Transforming Your Customer Experience with Agile Insights

Customer experience (CX) is everything. 

When done right, it can help you to turn casual buyers into full-fledged brand evangelists. But delivering a truly stellar experience doesn’t just happen by chance.

In fact, it requires a deep understanding of your customers, using research to uncover their experiences with your brand, and the ways you can better meet (if not exceed) their expectations. These efforts will ultimately help you grow your customer lifetime value, boost brand loyalty, and drive additional revenue.

Today, we’ll explore how you can use insights to transform your customer experience for the better. Diving into CX research, the importance of overall agility, and sharing some tips from our experts on ways to get better CX insights.  


What is Customer Experience Research?

To put it simply, customer experience research seeks to understand the experience your customers have with your brand, products, or services. Its reach is far, extending to everything from your branding and advertising to your product design or store layout. 

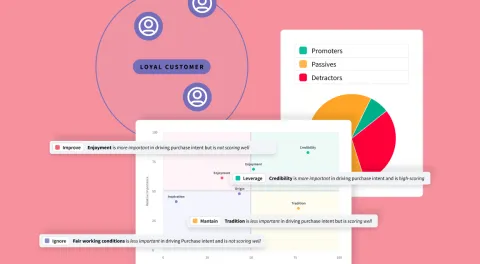
In practice, there are many ways to go about your CX research. You can collect data through strategically timed surveys delivered to correspond with your customer journey milestones, calculate your Net Promoter Score, and/or use natural language processing to analyze product reviews. Through your research, you will be able to better understand your customer's actual pain points, the challenges they face, and any needs that may be going unmet. Using that information to create as frictionless an experience as possible.


Why Does Agility Matter?

Agility may just be the key to successful CX research. IF you’re going to create a frictionless environment for your customers, you should also try to operate in one. And, it comes into play two ways: in how you conduct your research and how you apply the findings. We’ll start with the former. 

Customer experience data is far from static. This means instead of conducting large-scale studies a few times a year, you’ll need to approach your research a bit differently. Instead, opting for small-to-medium-sized projects at a more regular cadence. Using online surveys distributed to your own audiences or panels is a popular approach for agile research. Similarly, using research platforms that automate the analysis process also makes frequent testing much more frictionless. 

Now, for the latter. 

Once you're getting insights on your customer’s experience regularly, you’ve got to apply them in a way that makes a real impact. Avoid data silos and work cross-functionally within your organization to make sure your insights quickly make it to every team or department that may be necessary to facilitate changes. This will help you to cut through any initial roadblocks, allowing you to act on your insights quickly. 


How to Conduct Agile Customer Experience Research 

Conducting agile CX research may seem daunting, but following this 6-step workflow can help you to get started. 

Type=Default, Size=sm, Color=SuccessDefine Your Goals & Set Research Objectives: Before conducting any customer experience research, it’s essential to gather all parties involved. Take time to set clear expectations for your project; what exactly are you looking to find out? How do you plan to use those insights once you have them? This will make all of the subsequent work much simpler. 

Type=Default, Size=sm, Color=Success

Ask the Right Questions: To get actionable data, you'll need to develop a good survey. One of the easiest ways to do that is to keep your audience in mind throughout the entire process. You’ll want to keep things concise- remember people are taking time out of their day for this. So, the best way to respect that time is by not taking up too much of it! In return, you’ll get a higher completion rate and better data. (For info on creating user-friendly surveys, check out this blog). 

Type=Default, Size=sm, Color=SuccessReach Your Audience at the Right Time: Before sharing your survey far and wide, identify some of the best touchpoints in your customer journey. These touchpoints can then serve to inform when you share your survey with customers. Maybe that time is post-trial activation, or after a customer service call. This will ensure you get more responses and users aren’t put off by a seemingly random survey.

Type=Default, Size=sm, Color=SuccessDig into Your Data: When analyzing your data, you’re going to want to do a deep dive- not a shallow skim. If that sounds difficult, don't worry- it’s not. Using automated tools you can more easily test for significance, find correlations, spot patterns, and segment your respondents by demographic, geographic, behavioral, or psychographic data. Analyze the areas where your customer experience lacked to start improvement plans and look into the areas where you succeeded to understand what you’re doing right.

Type=Default, Size=sm, Color=SuccessImplement Your Insights Effectively: Make sure that all of your relevant findings get to each department that has played a role in your success or will need to be included in an improvement plan. And the sooner the better. By addressing customer feedback swiftly, you can avoid further negative experiences.

Type=Default, Size=sm, Color=SuccessGo Back to Square One: The key to agility is ensuring you regularly conduct customer experience research, allowing you to constantly improve and adapt your CX strategy. Because customers are (hopefully) always having new experiences with your brand, this type of research is fluid and ongoing. So, make sure you take the time to revisit your goals every now and then to better serve your organization. 


Getting Agile Customer Experience Insights with SightX

The SightX platform is the next generation of consumer insights tools: a single, unified solution for engagement, understanding, advanced analysis, and reporting. It helps insights and CX teams in any field to deliver unforgettable experiences tailored specifically to their customers' needs. 

Remove the guesswork from your current CX strategy by going directly to the source. Start a free trial today!
 

Estimated Read Time
4 min read

What is Content Strategy and How to Deliver Engaging Content with Insights

Content marketing is nothing new, but as many marketers already know- the rules just keep on changing. 

In the early days, you could throw up a questionably written 300-word blog post with a few keywords sprinkled in and improve your rankings. But today, that strategy will get you nowhere. 

That's because not only have search engines become more discerning, but so have people. 

Today, consumers look for meaningful content that answers their questions, provides them with helpful resources, and is easy to understand. And it turns out, what matters to them may also be quite important to search engines. It’s long been speculated (yet unproven) that user behavior on your site may affect your SERP rankings.

But whether or not that holds true- creating high-quality content that keeps your users engaged will undoubtedly raise your rankings and drive new traffic to your site. 

So how do you avoid churning out meaningless or unengaging content? With a solid strategy, backed by content research. 


What is a Content Strategy?

A content strategy is focused on the planning, development, and management of your content. Its main goal is to ensure your content is useful for your audience, easily found, SEO-optimized, and in service of your business objectives. 

It’s important to note- a content strategy is NOT simply creating pieces of content loosely linked to your company's goals. A true content strategy requires planning, effort, and a lot of questions- “Who is this content for?”, “What purpose will this content serve”, and “Why would a prospective customer want to read this?"


Why is a Content Strategy Important? 

The goal of a content strategy is to draw potential customers into your marketing funnel. 

But that doesn't just happen by chance. 

To develop a truly effective content strategy you have got to know what your audience is interested in learning, what content formats they prefer, and where they generally get their information. 

By centering your content strategy around high-quality consumer insights you can more easily target the right audience with the right message. 


How Can I Develop a Great Content Strategy? 

The best way to find out what content resonates with your audience is to simply ask!

While traffic and behavioral data gathered through Google Analytics can give you a basic understanding of the most (and least) popular pages on your site- it won’t tell you the full story.

Who exactly is viewing your content? What are their expectations? And what actions did your content inspire them to take? 

If you want to answer these questions, you’ll have to go straight to the source. Content research is a simple want to do this, allowing you to directly survey the audience you're trying to target. 

Using content research, you can discover the topics that matter most to your target audience, the trends they are currently following, and the questions they need answers to. By gathering their feedback and integrating it into your content strategy,  you can more easily address your audience's needs in an engaging way. 

Set your objectives 

The first step is to lay out the goals and objectives for your content research. Compile a list of all of the things you would want to know about your ideal audience. What subjects/topics are most important to them? What content formats do they prefer? How do they generally search for content like yours? Once you’ve got your list, pair it down to only the essentials. This will ensure your study is focused and won’t fatigue respondents. 

Define your audience

Next, think about your target audience. How would you define them? If you’re a B2B company, you may want to consider job functions, seniority levels, company sizes, or industries. If you’re in the B2C space, consider demographics, interests, or buying habits. Use these indicators to develop screening questions at the beginning of your experiment. This will ensure you only receive data from those in your target population. You may want to consider asking questions like: 

For B2B

  • Which of the following industries do you work in? 
  • Which of the following teams or departments are you a part of? 
  • What is your current position? 
  • What is the size of your company?

For B2C

  • Please select your age range below. 
  • Which of the following genders do you identify with? 
  • What is your annual household income? 
  • How often do you shop for [X]? 


Develop your survey

After that, your survey questions will depend entirely on your content research goals.

If you want to know the best social channels to distribute your content through, ask respondents which they use frequently. If you're looking to create a new content series, you may want to ask which format(s) your audience prefers to interact with. 


Simple Metrics to Track 

While web analytics data may not be able to give you the in-depth insights that content research can, you can still use this data to track and benchmark your performance over time. This will help you to understand if you are indeed on the right track for meeting the expectations of your audience.

Depending on your ultimate objectives, there are a variety of KPIs  that you may choose to track. If you're interested in increasing your reach and attracting new visitors to your website, you may consider monitoring: 

Type=Default, Size=sm, Color=SuccessNew Users

Simply, the number of new users that visited your website. 


Type=Default, Size=sm, Color=Success

Unique Pageviews

This metric aggregates pageviews that are generated by the same user during a single session. Meaning, if a person looked at the same page multiple times in one session, it would only be counted as a 1-pageview. 


Type=Default, Size=sm, Color=SuccessSearch Terms

Depending on the tools you use, you may be able to track the search terms people use to find your content. Keep a close eye on this data and adjust your keyword placement and strategy if you notice your blog isn’t getting the right kind of attention. 

And, if you’re goals are to increase engagement, you might instead track.


Type=Default, Size=sm, Color=SuccessPages per Session

The average number of website pages visited during a single session. 


Type=Default, Size=sm, Color=SuccessTime on Page

The average time users spend on each page. 


Type=Default, Size=sm, Color=Success

New vs Returning Users

The ratio of people returning to your website when compared to those entering for the first time (on that device). 


Content Research Best Practices


Type=Default, Size=sm, Color=SuccessSet Goals & Objectives Early

Gather your team and any/all stakeholders for a (zoom) meeting to hash out the specific details of your content research project. During this meeting, make sure to get a clear understanding of what everyone is looking to get out of the study before it begins. 


Type=Default, Size=sm, Color=SuccessGet Creative

Don’t shy away from trying something new. Once you have your first content research study under your belt, consider concept testing your content. Or, add heatmaps into the mix to uncover what users find most, and least, engaging. 


Type=Default, Size=sm, Color=SuccessTest Frequently

To have the most up-to-date insights on your target audience, you'll need to test frequently. Circle back to your original sample, or reach out to an entirely new group of respondents to keep track of emerging trends or market changes. 


Content Research with SightX

The SightX platform is the next generation of market research tools: a single, unified solution for consumer engagement, understanding, advanced analysis, and reporting. It allows marketers, content creators, and creative professionals in any field to deliver content that resonates with their audience. 

Remove the guesswork from your current strategy by going directly to the source. Utilize a mix of quantitative and qualitative consumer insights to generate more engaging videos, articles, blogs, infographics, and more.

Get started today!

Estimated Read Time
5 min read

Key Methods for Optimal Market Segments & Market Segmentation Techniques [Webinar On-Demand]

Have you considered that your customers are more diverse than your messaging, branding, or outreach strategies? 

In our post-demographic age consumers continuously construct (and reconstruct) their identities, making delineations based on age, gender, ethnicity, income, or education far less effective than previously thought.

Check out our latest on-demand webinar to learn how to reimagine your customer segments (or uncover new ones) with a fresh approach, sound methodology, and a little help from automation.

During this discussion, we cover: 

Type=Default, Size=sm, Color=SuccessThe pitfalls of segmentation methods that rely too heavily on demographic and geographic data. 
Type=Default, Size=sm, Color=SuccessExpert tips to level up your segmentation techniques. 
Type=Default, Size=sm, Color=SuccessHow behavioral and psychographic data points can play a larger role in your segmentation efforts. 
Type=Default, Size=sm, Color=SuccessAnd how to  incorporate qualitative insights for more robust personas. 


This webinar was originally hosted by Greenbook

If you're interested in learning more about market segmentation, we'd recommend our blog: 

Consumer Segmentation: Maybe You Could Be Doing it Better.

And, if you're ready to reimagine your market segments we are here to help! Just hit the "Request a Demo" button on the right-hand side of the page. 

Academic Siggy


Estimated Read Time
1 min read

Getting Started with DIY Market Research

As both research departments and budgets shrink, it’s becoming increasingly difficult to get the same level of insights with far fewer resources. 

Thankfully, DIY market research has the solve.


What is DIY Market Research? 

DIY market research simply means that you (the "y" in DIY) do the research yourself, instead of outsourcing it. This can include coming up with a strategy, developing questions, distributing the survey, and analyzing the data. 

Generally, this is done online with the help of market research software that streamlines the process. 


Who Is DIY Market Research For? 

Whether you're a small start-up or a well-established brand, consumer insights can mean the difference between standing out in the crowd or just blending in. 

But for some, spending a heavy chunk of their budget to outsource a few research studies isn't an option. This doesn't just apply to small businesses or start-ups, it can also apply to large or mid-market organizations with small insights teams. 

While DIY research was once an arduous process full of menial tasks, it has since become an elegant solution to the "do more, with less" problem that so many companies face.


How to Use DIY Market Research

When it comes to practical applications, there are innumerable ways to utilize a DIY approach to market research. Some of the most popular areas of experimentation include:


Type=Default, Size=sm, Color=SuccessProduct Research

Product research allows you to investigate and test every aspect of your product, from MVP to post-launch upgrades. Evaluate whitespace opportunities, test concepts, and optimize features through experiments like concept tests, conjoint analysis, MaxDiff, and more. 


Type=Default, Size=sm, Color=Success

Brand Research

This type of research helps you measure the overall performance of your brand through metrics like brand awareness, usage, purchase, loyalty, and net promoter score (NPS). Similarly, you can use studies like brand tracking or brand health tracking to keep a pulse on the market and understand how your brand performs over time. 


Type=Default, Size=sm, Color=Success

Pricing Research

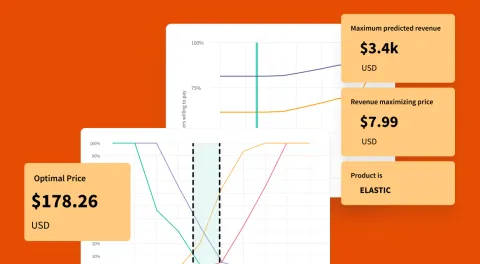
Pricing Research enables you to test price sensitivity in the market and discover what consumers are willing to pay for your offerings through experiments like conjoint analysis, price rating, Gabor-Granger, or Van Westendorp’s Price Sensitivity Meter. 


Type=Default, Size=sm, Color=SuccessMarketing & Advertising Research

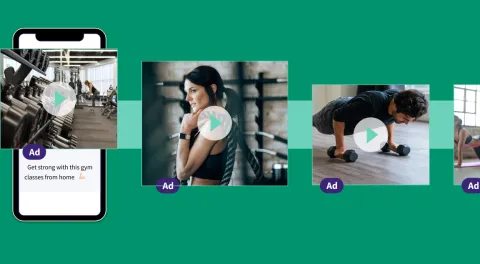
Just as the name implies, marketing and advertising research allows you to test your messaging, copy, visuals, and other collateral through ad concept testing, heat mapping, conjoint analysis, and more. Receiving  feedback directly from your target audience will help you refine your collateral and create more impactful marketing campaigns.


Type=Default, Size=sm, Color=SuccessCustomer Experience Research 

Also known as user experience research, these studies involve diving into customer feedback to better understand their experiences with your products and brand. Explore user preferences, sentiments, and key drivers of loyalty through market segmentation, Voice of the Customer (VoC) research, customer satisfaction surveys, and more.


Type=Default, Size=sm, Color=SuccessContent Research

For those in marketing, media, or entertainment, content research allows you to analyze and integrate audience feedback into your content to maximize its effectiveness. Through experiments like concept testing and conjoint analysis, you can better understand the topics that resonate with your audience(s) and deliver content that expands your influence.


Best Practices for DIY Market Research

While experienced research and insights professionals can often jump right into DIY techniques- it's not exclusive to experts! Even newcomers can thrive with a bit of guidance and support:


Choose the Right Platform

Picking the best platform for your research is crucial for long-term success. An end-to-end solution that allows you to build projects, distribute surveys, and visualize the results in a single hub will significantly simplify and streamline your operations. And if you plan on running more complex research studies in the future, like MaxDiff or Conjoint analysis, automation is key- and will save you a lot of time. 


Do Your Homework Before You Begin

Before you dive into any project, you'll need to outline your goals and objectives. Whether it's your first or 101st project, think carefully about what (exactly) you want to find out and how you plan to do so. Similarly, work with all stakeholders involved to lay out your goals, timelines, and roadmap. Presenting all of these items upfront can save you a lot of stress on the back end.


Take Your Time on the Design

A poorly designed survey with poorly worded questions will get you nowhere. But writing effective and unbiased questions is not quite as simple as you'd think. As a general rule of thumb, don't make your surveys too long and keep the questions straightforward. It can also help to have your co-workers test (and retest) your survey until the language and user experience are flawless. If you're looking for some additional guidance on this topic, check out our blog on survey question design here or see our guide to SightX survey logic here. 


Don't Be Afraid to Ask for Help

When in doubt- ask the pros! Whether you need simple survey scripting or analysis assistance- take advantage of supportive research services to guide your experience. Not only will this make your projects more effective in the short team, but you can also fill your own knowledge gaps long term.


Test Frequently

Whether you're running a brand tracker or developing a new product, frequent testing can help you verify your data and keep a pulse on the market. While every project will require a different level of iterative testing, it's important to consider how outside factors may be affecting your respondents. Volatile markets, pandemics, and political turmoil can all have a massive effect on consumer psychology. Plus, the more often you flex your research muscles, the stronger they will become.


Take Time for Continuing Education

Grow your basic understanding into a solid foundation with educational content and resources. There are many ways to go about it- be it attending industry trade events, catching relevant webinars, or perusing the SightX Blog- you can’t go wrong. 

DIY Market Research with SightX

The SightX platform is the only market research platform you'll ever need: a single, unified solution for consumer engagement, data collection, advanced analysis, and reporting. While powerful enough for insights teams at Fortune 500 companies, the user-friendly interface makes it simple for anyone to start, optimize, and scale their research. 

With our new Generative AI research consultant, you can have studies generated in a matter of seconds and get key insights pulled from your data instantly. 

Whether you are ready for a total DIY experience or prefer some guidance and support- we’ve got you covered. Reach out today to get started!


Estimated Read Time
5 min read

What is Net Promoter Score? How to Calculate NPS and Conduct NPS Surveys

For over a decade, the Net Promoter Score (NPS) has been one of the most widely used metrics in market research. And for good reason, as it allows companies to more tangibly measure their customer satisfaction and loyalty. 

When earlier methods of calculating and quantifying customer satisfaction fell short, a Bain & Company team led by Fred Reichheld set out to find a new approach that would drive actionable results. That's when they found that a single question correlated most strongly with purchasing and referral behaviors. That question became the foundation of the NPS.


What is a Net Promoter Score (NPS)? 

A Net Promoter Score is a measure used to gauge customer loyalty, satisfaction, and enthusiasm for a brand. It accomplishes this by asking respondents a simple question: "On a scale from 0-10, how likely are you to recommend this product (or company) to a friend or colleague?"

This metric is often considered the gold standard for customer experience, used by millions of organizations to measure and track how they're perceived by their customers. 


Why NPS Measurement is Crucial 

While simple, your net promoter score can be used to measure customer satisfaction and how likely a customer is to recommend your business to family and friends. Similarly, it can be used to gauge and predict customer loyalty- making it a crucial metric for any and every business.

NPS measurement is one of the most straightforward ways to understand how your brand fairs with consumers. And because it’s an easy metric to evaluate, you can easily benchmark and track your brand’s public perception over time. 

 As you come to better understand your NPS score and its key drivers, you can learn how to improve your business. Allowing you to build stronger relationships with your current customers and grow your loyalty with new audiences, building an ever-growing base of brand advocates. 

Whatsmore, your net promoter score is also a great indicator of your future growth. According to research by Bain & Company, an industry’s net promoter leader will outgrow its competitors by a factor greater than 2x on average.


How to Calculate a Net Promoter Score (NPS) 

Determining your net promoter score is nearly as easy as collecting the data.

In your NPS Survey, you will ask your customers the question: “On a scale of 0 to 10, how likely are you to recommend our business to family, friends, or colleagues?” Based on the rating each customer gives you, they can be classified into one of three groups: 


Promoters

Promoters are those respondents who rated your company a 9 or 10. These are your loyal customers- they love your products, services, and business as a whole. They are often repeat buyers and will happily recommend you to other potential buyers.  


Passives

Passives are the respondents who rated your company a 7 or 8. These are the customers marginally satisfied with your company, but not enough to be loyal repeat buyers. Similarly, they are not entirely dissatisfied- making them unlikely to speak positively or negatively about your brand. 


Detractors

Detractors are the respondents who rated your company a 0 to 6 on a 10-point scale. As the name would suggest, they are not pleased with your products, services, or brand. They are likely to spread negative word of mouth and are unlikely to purchase from you again. 

Once the feedback is collected, your NPS calculation can be done by subtracting the percentage of detractors from the percentage of promoters. You will come up with a number between -100 and 100. 


academic-siggy@2xTip: Consider adding an optional open-ended text response after your NPS question- it allows customers to provide you with context surrounding their rating and can be analyzed with Natural Language Processing (NLP) for sentiment analysis. 


NPS Industry Benchmarks

If you're wondering what is considered a "good" net promoter score- you're not alone!

While there is no catch-all NPS benchmark, research shows that there are a range of net promoter scores considered average within each industry.  

For example, SaaS platforms generally average an NPS of 30, while service-based businesses like cable TV or internet often bring in an NPS of -2 or -3. 

In order to fully understand where your net promoter score falls, it's best to do a little research on your industry. While not necessarily drastic, benchmarks can change year to year- so make sure you find the latest data!


Best Practices for Launching Your NPS Survey

Overall, launching your own NPS survey is quite simple, but there are still a few key items you should keep in mind: 

Type=Default, Size=sm, Color=SuccessInclude the Right Questions

Outside of the obvious, there are a few additional questions you may want to include in your NPS survey. A few demographic and/or screening questions will allow you to better understand how different customer segments respond to your offerings. With this information, you can identify common issues with particular buyer personas or discover the persona that typically matches a 9-10 rating. Additionally, you may also want to consider an open-ended follow-up question directly after your NPS rating to find out why customers gave the response they did. 


Type=Default, Size=sm, Color=Success

Context is Key

Make sure that you send out your NPS survey at the right time. Do not bombard brand new customers- give them time to explore your brand and get to know your product. If you reach out too early, the feedback won't be as valuable. While the exact timing will be different for every company, wait until customers have some time to enjoy your product or activate an important feature. 


Type=Default, Size=sm, Color=Success

Test Frequently

One of the main benefits of the net promoter score is the ability to track it over time. To truly improve your NPS, it’s crucial to run experiments often and benchmark your progress over time- but don't overdo it. By reaching out at regular intervals, you may find that your detractors become passives and your passives may become promoters given time and exposure. 


Type=Default, Size=sm, Color=Success

Close the Loop

It should go without saying, but the data you get from your NPS survey won't do you much good if you do not take action. When you survey your customers, make sure that they understand how you intend to use this information to improve your product, brand, marketing, etc. If you receive negative feedback from a customer, reach out with follow-up questions to better understand their problem. This is not only a great way to mend the relationship, but it also allows your organization to improve. 


Type=Default, Size=sm, Color=Success

Choose the Right Research Platform

Choosing a platform for your NPS study is crucial. An end-to-end solution that provides both flexibility and support will markedly streamline your research. For analyzing the text of your open-ended follow-up question, NLP functionality will enable you to analyze your results by topic, keyword, theme, or sentiment to uncover trends, opportunities, or possible problems. 

NPS Surveys with SightX

The SightX platform is the next generation of consumer insights tools: a single, unified solution for engagement, understanding, advanced analysis, and reporting.  

If you're ready to turn your customer feedback into growth, SightX has the tools you need to launch NPS surveys, calculate your score, and benchmark your NPS over time. Reach out for a Demo to learn more!

Estimated Read Time
5 min read

What is Survey Logic and How Does it Work?

If you want the highest quality data from your research, you'll need to give respondents a clear path through your survey.And that requires thoughtful and intelligent design.

By optimizing and shortening the overall survey experience, you can lessen the possibility of respondent fatigue. Which, in turn, helps to protect you against data degradation.

Aside from writing effective questions, you can use survey logic to streamline the respondent experience. 

We’ve put together a guide to help you better understand how different types of survey logic work and how to apply them to your next project.


What is Survey Logic? 

When you design a survey, you might find that not all of the questions you’ve developed apply to your entire respondent pool. Survey logic allows you to change the survey content based on respondents' answers. This can include skipping pages, looping sets of questions, and even setting quotas on the types of respondents you need. 


Why is Survey Logic Important? 

When used properly, survey logic shortens your survey and gives respondents a clear path free from erroneous questions. This, in turn, helps increase completion rates and reduce respondent fatigue (a large contributor to poor-quality data). 


Types of Survey Logic

There are many different types of survey logic you can apply to your project’s design. Some of the most popular include: 

Conditional Display

Conditional display logic works by hiding or displaying specific questions or answer options based on a respondent's previous answers. This allows you to better personalize the survey for your respondents by only showing the question and answer options that apply to them. For example, if you asked respondents whether they prefer coffee or tea, you could use conditional display logic to show appropriate follow-up questions based on the respondent's selection. 

Multi-Question Logic

Similar to conditional display, multi-question logic allows you to route respondents to specific questions based on their responses to multiple questions. For example, if you only wanted respondents who made over $150k a year AND were the primary grocery shopper in their household, you could screen out anyone who did not provide those two answers. 

Question Skip Logic

Skip logic allows you to route respondents around specific questions that do not apply to them. For example, if a respondent says they have never used one of the products you’ve asked about, you would want them to skip the following question about their satisfaction with that product. 

Page Skip Logic

Just like the skip logic above, page skip allows you to route respondents around entire pages that do not apply to them. For example, if a respondent says they have never used one of the products in your survey, you would want them to skip the following page with follow-up questions about their experience with said product. 

Question Looping Logic

Much like the name would imply, looping logic is used to ask respondents the same question, or set of questions, multiple times based on their previous responses. For example, if you had respondents choose the specific products they had recently bought, you may then want to “loop” them through a set of questions asking them for more information on each. 

Question and Answer Piping Logic

Piping logic is used to “pipe”, or insert, a respondent's answer choice into a question later in the survey. For example, if your respondent had chosen “Nike”, “Adidas”, and “New Balance” as shoe brands they recently purchased, you would want to “pipe” those answer choices into the follow-up questions regarding their purchase experience with the shoes. 

Disqualification Logic

Disqualification logic uses screening questions to disqualify respondents that do not meet the requirements of your quota. These respondents would not be counted towards your quota, and their answers would not be included in the data analysis. For example, if you only wanted feedback from respondents between the ages of 25-35 that lived in urban settings, you would use screening questions at the beginning of your survey to weed out those respondents who did not meet your qualifications. Those that do, count towards the overall response limit that you set.

Numeric Logic

Numeric logic is the ability to set logic based on numeric questions in relation to each other. For example, if a respondent gives an answer to Question 2 that is greater than their answer to Question 3, you could skip them to another area of your project. 

End-of-Survey Logic

As the name would suggest, end-of-survey logic allows you to route a respondent  to the end of a survey. However, this is different from disqualification logic, as the respondent's answers will be included and they will be counted towards your total. 

(BONUS) Quotas

Only because we mentioned them above, survey quotes represent the number of respondents needed to meet your specific requirements- like the number of women or people in a specific age group. For example, if you want a sample representative of the general population of the United States, you would need your respondent gender breakdown to be: 49% female, 49% male, and 2% non-binary. To accomplish this, you would use the quotas system and specify those percentages. 

(BONUS) Nested Quotas

Nested Quotas add another layer of complexity to your quotas by including a specific breakdown of percentiles not just across one variable ( like sex), but by nesting multiple variables like age groups, income, etc.


Surveys with SightX

The SightX platform is the next generation of market research tools: a single, unified solution for consumer engagement, understanding, advanced analysis, and reporting. It allows insights, marketing, and CX teams to start, optimize, and scale their insights workflow.

But, SightX isn’t just great tech. Our Research Services team knows all of the best practices, along with some tips and tricks for getting the best data out of your surveys.

Remove the guesswork from your current strategy by going directly to the source. Reach out to our team to get started today. 


Estimated Read Time
4 min read

Market Research Glossary

Diving into the world of consumer and market research can be a challenge. To help, we’ve put together a glossary of some of the most common terms you will come across. 

academic-siggy@2xTip: If you are looking for something specific, use Ctrl + F to search for the term(s) you came here to find!


A/B Testing:

A/B Testing (also known as split testing), is the process of comparing two versions of a web page, email or other marketing asset, tagline, package, etc., and measuring the difference in performance. This is done by sharing version A to one target group and version B to the other target group, followed by a set of standard questions, and then evaluating how each variation performs. You can accomplish this in SightX by creating a Concept Test.


ANOVA (Analysis of Variance):

ANOVA is a type of significance testing. It is a statistical method that establishes the existence of a difference between several sample means. While the t-test is used to compare the means of response variable between two groups of predictor variables, ANOVA is used to compare means between two or more groups. So, an ANOVA with only two groups is equivalent to a t-test.


Behavioral Segmentation: 

Behavioral segmentation is a type of market segmentation that groups customers together based on their actions like browsing or shopping habits. 


Cohort: 

A group of people that have a statistical factor (age, gender, etc) in common. 


Concept Testing:

Testing on a target market segment employed to evaluate concepts or ideas. The testing results can determine the most appropriate pricing, brand concepts, appeals, and positioning strategy concepts. Get our best tips to optimize your next concept test.  


Conjoint Analysis:

A survey-based statistical technique used in market research that helps determine how people value different attributes (e.g. feature, function, benefits) that make up an individual product or service. It is used frequently in testing customer acceptance of new product designs. Read a more in-depth review of Conjoint experiments in our full blog. 


Control Group:

A group of people which is used as a cross-reference check for a sample group.


Control Variables:

A variable that is kept the same throughout the experiment, and it is not of primary concern in the experimental outcome. These are often demographic questions that allow researchers to filter, cut, and compare the data by one or more variables. 


Demographic Segmentation: 

Demographic segmentation is a type of market segmentation that groups customers together based on common traits like age, income, occupation, and more. 


Dependent Variable: 

Dependent variables are variables that depend on, or are affected by, the independent variables in a study. 


Drop-outs:

Respondents who suddenly stop completing the questionnaire. This is different from respondents who were routed to the end of the questionnaire or screened out due to logic (routing).


Focus Group:

A group of people who are brought together to informally discuss a market research question. These individuals are usually contacted by a marketing research company, on behalf of another company.


Gabor-Granger Pricing Technique: 

Gabor-Granger is a type of pricing research that can help to determine the price elasticity of products or services. The goal of a Gabor-Granger study is to find the maximum price consumers are willing to pay. 


Geographic Segmentation:

Geodemographic segmentation is a type of market segmentation where customers are grouped together in regards to their physical location. 


Heat Mapping:

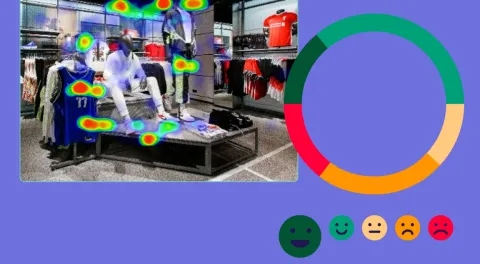
A graphical representation of data where the individual values contained in a matrix are represented as colors. Heatmaps help you get an instant feel for an area by grouping places into categories and displaying their density visually to the researcher. For more information, see our blog on heat mapping. 


Independent Variable:

Variation is independent of changes in the values of other variables and is the causative factor. For example, if sales and price were your two variables, price could be the independent variable because it causes sales to increase or decrease (or vice versa).


Likert Scale:

A bipolar scaling method, measuring either positive or negative response to a statement. Likert scales are widely used to measure attitudes and opinions with a greater degree of nuance than a simple “yes/no” question. Typically, either a 5 or 7-point scale is used that ranges from one extreme to another such as Agree to Disagree.


Longitudinal Study: 

A longitudinal study is a type of research study conducted over time by observing a specific variable to understand development over time. 


Looping (Survey): 

Looping logic allows you to route survey respondents through a block of questions based on their answers to specific screening questions. For example: If you ask respondents to choose their favorite brands from a list, you could then ask them questions about each brand “looping” them through the same set of questions each time. 


Market Segmentation: 

Market segmentation consists of segmenting prospective customers into groups that share common characteristics or needs. This can be done utilizing demographic, geographic, firmographic (B2B), psychographic, or behavioral data. For more information and best practices, see our full blog on market segmentation. 


Max-Diff Analysis:

Involves the ‘Best’ and ‘Worst’ scales in a given set. Researchers ask the respondents to pick the most and least important factors in given answer options. Read more in-depth information about MaxDiff experiments on our blog. 


Monadic Testing: 

Monadic testing is a type of research that introduces survey respondents to a single concept in isolation. This ensures independent findings for each stimulus, unlike comparison tests which allow respondents to see multiple concepts and compare the two. 


Machine Learning: 

Machine learning is a type of Artificial Intelligence (AI) that allows software applications to “learn” from the data it is fed. These algorithms use statistics to find patterns in the data it accesses and has the ability to provide suggestions or predictions based off of those patterns.

To learn how SightX applies machine learning to market research, see our blog series on Buzzwords.

Or for information on the intersection of machine learning and statistics, see our blog on the battle between machine learning and statistics over consumer insights.


Nested Quotas:

Nesting allows you to quickly create multiple quotas within a larger sample grouping together (ex: age, gender, ethnicity, etc.). It is when requirements from different quotas are combined together, for example ‘Females in the 18-25 age bracket'.


Piping (Surveys): 

Piping allows you to take text from one question or set of answers, and “pipe” it to another set of question or answer options. For example: If you ask respondents to choose their favorite brands from a list, you could then ask them questions about each brand. In the following question blocks about each brand, the brand name would be “piped” from the original question. 


Pivot Table:

A statistics tool that summarizes and reorganizes selected columns and rows of data in a spreadsheet or database table to obtain a desired report. The tool does not actually change the spreadsheet or database itself, it simply “pivots” or turns the data to view it from different perspectives.


Psychographic Segmentation:

When you break your customer groups down into units as it pertains to their beliefs, values, interests, and more. It's defined as the psychological aspects that influence consumer purchase behavior such as lifestyle, social status, opinions, and hobbies.


Qualitative Research:

Qualitative research involves collecting and analyzing non-numerical data to better understand consumers' opinions, feelings, sentiments, and more. This type of data cannot be measured traditionally, and is instead analyzed for themes and sentiments for a better understanding of consumer behavior. 


Quantitative Research: 

Quantitative research strictly uses numerical data to better understand and predict human behavior. Data is collected and analyzed to better understand or predict consumer behavior, market trends, and more. 


Quota: 

Quotas are the number (or percentage) of respondents needed to meet a specific requirement. Often researchers will use quotas to ensure the sample is representative of the population, or specific audience they are targeting. For example, you may want 51% of your survey respondents to be female, and 49% to be male. 


Response Rate:

The actual percentage of questionnaires completed and returned.


Sample:

The population researched through your survey.


Sequential Monadic Testing:

Sequential Monadic testing is a type of research where concepts are evaluated in succession, one after the other. Unlike monadic testing which requires respondents to look at concepts in isolation, sequential monadic testing invites comparison between concepts. 


Significance Testing:

Considers the likelihood that the sample data has come from a particular hypothesized population. Statistical significance helps quantify whether a result is likely due to chance or to some factor of interest. In other words, when a finding is significant, it simply means you can feel confident that it's real and not just a matter of who is in the sample.


Survey Logic:

Instructions that are used in the survey design phase to route respondents to particular questions or question sets within the questionnaire. For example, skip logic is used to route respondents around particular questions that do not apply to them. Branching logic is used to route respondents to different locations in the questionnaire based on their responses to a particular question.


Trend Analysis:

Analysis of past and current market behavior and dominant patterns of the market and consumers. An important aspect of conducting trend analysis for an organization is to obtain insights on the market scenario, consumer preferences, and the macroeconomic environment over time.


Van Westendorp's Price Sensitivity Meter:

Van Westendorp’s price sensitivity meter is a method of pricing research that allows you to find the lower threshold, upper threshold, and optimal price point for your product or service. 


Estimated Read Time
7 min read

Your Guide to Pricing Research

Finding the perfect pricing for your product is no easy feat. 

While price can majorly influence consumers' buying habits, it's an equally important factor for businesses. Finding the optimal price point can allow you to attract buyers, maximize profits or grow market share.

But choosing a pricing strategy isn't quite that simple. 

If you choose a price point that is too low, consumers might well assume your product is low quality. But on the other hand, if the price is too high you'll likely turn them off altogether.  

After investing months (or even years) in product development, honing in on the perfect pricing strategy is crucial for success. Research from Harvard Business School has shown even a 1% improvement in your pricing can generate up to an 11% increase in your profits. And what is the best way to improve your pricing? Pricing research. 

Pricing research allows you to discover what consumers are willing to pay for your product or service. Depending on the type of pricing research, you can better understand the value consumers place on both your product and its features. 

With the data collected, you can then determine the optimal pricing that boosts sales, increases market share, and piques consumer interest. 

Pricing Research Methods 

The research methodology you choose is dependent on your research goals, the maturity of the product, and other data points. Below are a few techniques to consider: 

Conjoint Analysis

We would recommend using Conjoint Analysis if you are interested in learning not only about price, but also the optimal combination of product attributes to pair with it. It can help you optimize your product and your pricing. 

Conjoint analysis helps to identify the rules consumers explicitly (and implicitly) use to make their purchasing decisions. The premise of this technique is fairly simple. Consumers conduct mental trade-offs between pricing and other factors like quality, functionality, style, etc. 

For this type of research, you expose consumers to multiple product components shown in various combinations, each with different pricing. Once the data is collected, the subsequent analysis will show you what features consumers value the most and the price(s) they are willing to pay for them. 

For example, say you have new ice cream flavor ideas. You may want to test:


Price: Size: Flavor:
$10 Small Milk Chocolate
$15 Medium  Pistachio
$20 Large Dark Chocolate 


Once you’ve identified your features and pricing, all that is left is to use the SightX Conjoint functionality. Simply insert your combinations and the platform will generate a balanced experiment. 

The analysis will leave you with a clear understanding of your optimal pricing and the value consumers place on each of your product features. 

If you’re interested in learning more see our full blog on conjoint analysis.

Price Rating with Concept Testing

This study will provide you with insights into the overall favorability and sensitivity to various pricing brackets. 

Concept testing is the process of evaluating a product feature to better understand the way it will be received by consumers in the market. Concept tests allow you to expose consumers to your offering and then directly ask for their feedback on its appeal, their purchase intent, and the amount they would be willing to pay for it. 

This test is quite straightforward. It works by simply sharing information about your product, usually via a combination of text and images, and then asking consumers about their degree of price sensitivity through a series of multiple-choice questions. 

For example, let’s say you have four price points you would like to explore: $30, $35, $40, and $45. You would ask questions like: “How likely are you to purchase [X Product] for $30?” Then: “How likely are you to purchase [X Product] for $35?” 

This would continue until you’d asked about all of your price points. We often recommend randomizing the order to ensure unbiased market research.

See our full blog on concept testing to learn more. 

Gabor-Granger Direct Pricing Technique

Gabor-Granger is similar to the test above and is best if you already have a defined price range and are looking to pinpoint the optimal price. 

Like the price rating method above, Gabor-Granger asks respondents if they would purchase your product at a specific price. The question is then asked again, with a new price. Often, this research is done with multiple price points, asking respondents: “Would you buy [X product] for $30”. 

The following questions change according to the respondents' answers; if they will purchase at $30, the next question will present them with a higher price. The goal of this research is to find the maximum price consumers are willing to pay. The data will then show you the optimal price for your product in the market. 

Numeric Price Entry

We would recommend numeric price entry if you're just exploring the pricing perceptions of your target audience. 

This method of pricing research consists of simply asking respondents: “how much would you be willing to pay for [X product]”. The aggregate responses provide insights into the average price consumers are willing to pay. 

Van Westendorp's Price Sensitivity Meter

This method of research is best if you are looking for a simple and quick study that will give you a lower threshold, upper threshold, and optimal price point.

It does this by asking respondents only four questions: 

  • At what price would you begin to consider the product so inexpensive that you would question the quality and not purchase it? 
  • At what point would you think the product to be a bargain? 
  • At what price would you say this product is starting to become expensive- to the point that you’d have to give some thought to buying it? 
  • At what price point would you consider the product to be so expensive that you wouldn’t consider buying it? 


Ultimately, the pricing research method you choose will depend upon your unique goals and current stage of product development. Whether your brand is looking to increase revenue, attract buyers, or grow market share, pricing research can help you succeed. 

Request a demo and started on your own pricing research with SightX today!


Estimated Read Time
4 min read

What is Ad Testing and How Do You Run Successful Ad Testing Campaigns?

Advertising can be a costly-if not risky- business. While great ads can skyrocket a brand to success, bad advertisements can similarly define a company-just, not in the ways they’d like. 

Some exceptional ads have resonated with such a large audience they went viral- think Wendy’s “Where’s the Beef” commercial. And others can get all of the components right but majorly miss the mark: the controversial Pepsi and Kendall Jenner ad of 2017.

But how can you tell for sure if you've struck advertising gold? Or instead, just come across another low-quality ad concept? Advertising testing is the solution. 


What is Ad Testing? 

Ad testing is the process of vetting your ad concepts with your target audience. You can use ad testing on an entire ad or just specific aspects of it, and collect feedback on how engaging, interesting, and eye-catching it is to consumers.  


Why Should You Test Your Ads? 

David Ogilvy, known globally as the father of advertising, once said, ”Never stop testing, and your advertising will never stop improving.” Ogilvy credited his incredible success to his meticulous research on consumer behavior. That's because he never underestimated the value of using insights to improve his process. 

In the current advertising landscape, brands are constantly competing for a share of voice. Consumers are constantly engaging with advertisements- whether it's through Google, social media, streaming services, or TV Networks, the list goes on. This makes it crucial to understand who your brand's audience is, what they like, and (most importantly) why. 

The process of ad testing enables brands to do just that by providing direct consumer feedback to implement into the ad development cycle. It does this by collecting insights from your chosen audience, allowing your team to hone in on the best visuals, copy, placement, and more. It also provides a level of certainty by giving you consumer data to back up your decisions.


What to Test

There are many aspects of your advertisements or campaigns that your team can test. Depending upon the chosen medium the variables can range widely, some of the most popular include: 

Type=Default, Size=sm, Color=SuccessAd Messaging

Is the copy relevant and engaging? Is the Call to Action (CTA) clear? 

Type=Default, Size=sm, Color=SuccessAd Creative

Are the visuals appealing? Does the creative vision come across well to consumers? 

Type=Default, Size=sm, Color=SuccessAd Placement

Which placement of an online ad results in the highest Click Through Rate (CTR)?

Type=Default, Size=sm, Color=SuccessUser Device

Which types of ads display and perform best across devices? 


Additionally, brands can use ad testing to find their most receptive consumer segments for a given campaign. Using the data collected, automated analysis can reveal new personas based on behavioral and psychographic data-see our blog on consumer segmentation to learn more about this process. 

While there are many more that could be included, overall ad effectiveness is our focus for this piece. Ad effectiveness studies can encompass many ad measurement metrics. By testing nearly any combination of the items listed above, you can walk away with a better understanding of what your most effective ad would be and who your target consumer segments likely are. 


When to Run Ad Testing

Ad testing is quite flexible in that you can test at any stage of the process. When you choose depends on your goals. 

Pre-testing allows your team to analyze and integrate audience feedback beginning early in the development cycle. There are numerous tests you can run from early-stage ad concept testing to later ad effectiveness research.  Pre-testing will, without a doubt, give you the highest level of confidence going into an ad or campaign launch.  

Ad tracking takes place concurrently, collecting ad effectiveness data via ad measurement tools in real time. There are various methods you can employ and metrics you can track-it simply depends on the type of ad and the platform it is running on. Ad tracking is most often used by digital advertisers, empowering them to optimize their ads as they run.

At the tail end, post-testing can be done periodically or continuously to monitor brand awareness, brand usage,  brand preference, and other metrics to understand the combined effects of all of your brand's advertising. Post-testing also works well to dissect ad effectiveness and campaign success after the fact, to help your team avoid mistakes and replicate what went well. 


Ad Testing Check-List 

To get the most out of your ad testing, make sure to keep in mind a few best practices: 


Type=Default, Size=sm, Color=SuccessSet Objectives

What are your ultimate goals for this advertisement? Is it to raise brand awareness? Drive product sales? Whatever it may be, make sure your team chooses the specific ad measurement metrics that reflect these goals. 


Type=Default, Size=sm, Color=SuccessChoose Your Approach

For pre-testing, ad effectiveness surveys are a common way to measure audience feedback. The two most popular survey methodologies are monadic and sequential monadic testing (our blog on Concept Testing digs into this topic a bit deeper). For ad tracking, you can utilize tracking URLs, pixels, cookies, and more to keep an eye on your ad's performance in real-time.  


Type=Default, Size=sm, Color=SuccessAnalyze the Results & Apply the Feedback

Utilize automated platforms to integrate both quantitative and qualitative insights. Apply the feedback you receive, repeat the process when needed, and launch your ad with confidence.  


Type=Default, Size=sm, Color=SuccessTest Frequently

Test and track your ads before, during, and after launch to understand the performance throughout the ad's lifecycle. 


Avoid These Common Ad Testing Mistakes

One big mistake to avoid in advertising is making too many assumptions.

Just because you have always used a certain “brand voice” or copywriting style, why not test something new? Maybe your previous copy has been too “salesy” for many potential consumers. Or, perhaps the language you use to describe your brand’s offering is not the same language your customers use. And the same can be true for the imagery- just because your team may love the colorful and brightly designed option consumers may just see it as distracting or loud. 

Additionally, make sure your “call to action”, or CTA, comes through loud and clear. Don’t ask too much of your audience, and definitely don’t send mixed signals. As a general rule, use one CTA per ad- something like “Learn More” or “Book a Demo Today”.


Ad Testing with SightX

If you’re ready to optimize your ads and campaigns  we’ve got the tools to make it simple. 

The SightX platform is the next generation of market research tools: a single unified solution for consumer engagement, understanding, advanced analysis, and reporting.

But, SightX isn’t just great tech. Our Research Services team knows all of the best practices, along with some pro tips and tricks for getting the best data out of your surveys and experiments.

Reach out to our team to get started today!

Estimated Read Time
5 min read

Webinar: Challenging the Traditional Concept of DIY Consumer Insights

DIY market research isn’t what it used to be. 

When you think of the traditional DIY methods of gathering consumer insights, chances are you think of a time-consuming process that requires expertise and a lot of effort.  But, as organizations strive to do more with less, intelligent and automated solutions are taking the burden off of the “Y” in DIY. 

Find out how the next generation of consumer insights platforms are empowering organizations of all sizes to start, perfect, and scale their research operations, increasing their impact on both consumers and the marketplace. 

In this webinar, we...

  • Delve into the history of DIY market research methods. 
  • Explore the benefits of new DIY research technology. 
  • Demonstrate how the most iconic and innovative companies are leveraging end-to-end DIY platforms to gain a competitive advantage and de-fragment their research process. 


This webinar was a part of the Greenbook Insights Tech Showcase.

If you're interested in learning more see our Reinventing Consumer Insights with A.I. Driven Analytics & Curiosity Webinar, or request a demo to find out how DIY market research software can help you do more, with less. 


Estimated Read Time
1 min read