7 Tips to Optimize Your Next Concept Test
We've said it before, and we'll say it again: Concept testing is one of the most versatile tools in your insights toolbox.
Whether you are in product development, marketing, branding, or customer experience- concept testing is invaluable for eliciting direct feedback from your target market.
And the data won't just save you from making costly mistakes- like launching a poorly designed product or publishing a confusing ad. The insights you gain from concept testing can actually help you further develop, perfect, and iterate on your ideas.
But before we dive into the nitty-gritty, let's define a few terms we'll be using:
![]() Concepts- Simply put, these are the ideas you will be testing. Concepts can come in many forms, from logos and ad creative to product prototypes and messaging.
Concepts- Simply put, these are the ideas you will be testing. Concepts can come in many forms, from logos and ad creative to product prototypes and messaging.
![]() Concept Test- This is the experiment you use to test the concepts you have developed. Think of a concept test as a bucket and the concepts as the items that go into it.
Concept Test- This is the experiment you use to test the concepts you have developed. Think of a concept test as a bucket and the concepts as the items that go into it.
Why Concept Testing is Crucial
Concept testing plays a major role in the trajectory of a new idea, providing critical insights and minimizing potential risks.
While your team might think their latest idea is genius, the opinions of your target market are the only opinions that really matter. And if that target market doesn't see the value in your idea during testing, they definitely won’t see the value once it’s released.
By concept testing your ideas first, you can better understand consumers' likes and dislikes and adjust course accordingly, repeating the process until you hone in on the best possible version of your concept. While this process can extend development timelines, it also eliminates the time you would have wasted chasing the production of a poor idea.
Because most concept tests can be done via online surveys there is a high degree of flexibility. This means you can easily gather feedback on many facets of your idea, allowing you to perfect every last detail before launch.
Our Top 7 Tips for a Better Concept Test
A good concept test is one that gives you precise feedback from your target market. By taking the time to thoughtfully design your experiment, you're more likely to get reliable data and usable insights.
To help you do just that, we've put together our best tips:
1. Establish goals early on in the research process.
While it might be tempting to load up your concept test with any and every question you've thought up, you should instead focus on the key insights you want to gain.
Gather your team and any other colleagues that may have a use for the data and ask yourselves some basic questions: What kind of responses would be most useful? How will we use the data once we have it? What metrics matter most to us?
Nailing down these details early in your concept testing process will ensure the data you collect translates to impactful insights.
2. Pick the right methodology for your needs.
Next up, you’ll need to pick a methodology that best aligns with your goals and project parameters. Two of the most commonly used are monadic and sequential monadic testing.
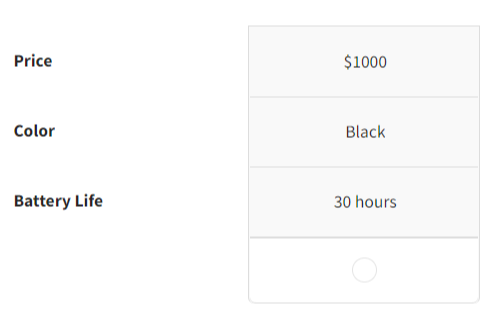
With a monadic design, the pool of respondents is split into groups, one for each concept. Each group is shown a single concept and asked a series of follow-up questions. Once the data is collected from all groups, you can compare the results and choose a winner.
Because each respondent is only shown a single concept, this design allows you to ask more in-depth follow-up questions while keeping the overall experiment short. This keeps things simple for respondents and eliminates potential interaction effects or bias.
However, there are some drawbacks.
Monadic testing requires a larger sample size, which can drive up the cost and time to insights.
That being said, we would suggest a monadic design if:
![]() You only have a few concepts you would like to test.
You only have a few concepts you would like to test.![]() You have the budget to capture feedback from a larger sample.
You have the budget to capture feedback from a larger sample.![]() You require detailed feedback on each of your concepts.
You require detailed feedback on each of your concepts.
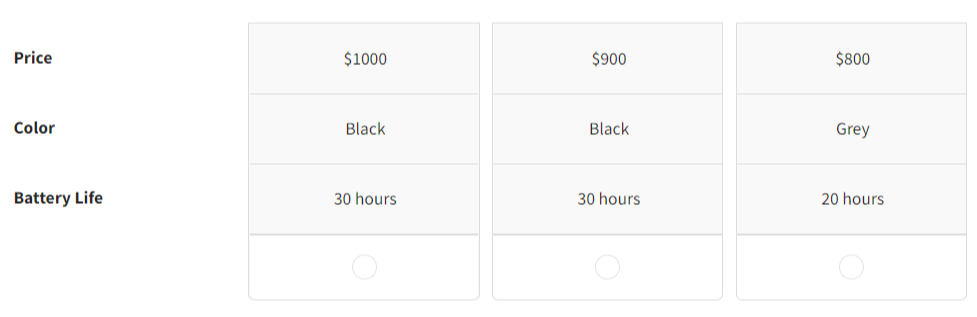
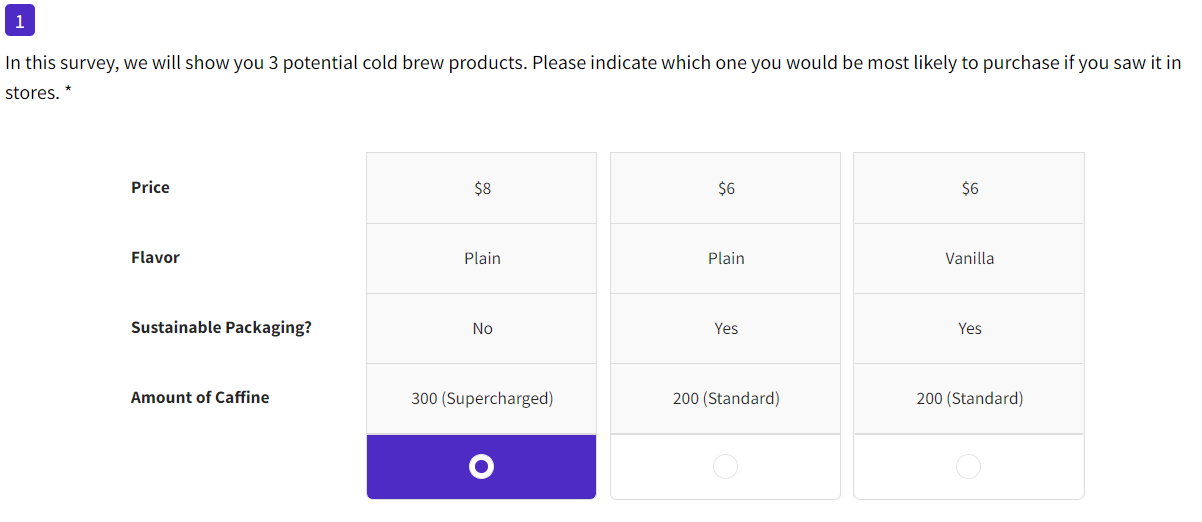
On the other hand, sequential monadic testing exposes respondents to two or more concepts in a single test. Each concept is presented in random order and followed by a short set of questions. After the data is collected- you can compare the concepts within a single test to find your winner.
Sequential monadic design is often the more efficient choice.
Because each respondent evaluates multiple concepts, you can use a smaller sample- reducing both the cost and lead time. Similarly, having respondents compare and rank your concepts can give you a deeper understanding of your audiences’ true preferences.
Additionally, if you want to use significance testing in your analysis- a sequential monadic design is optimal. This will allow you to compare the scores between concepts within the same test, helping you to quickly spot meaningful insights in your data.
But of course, there are some disadvantages.
Sequential monadic testing greatly limits the number of follow-up questions you can ask about each concept. And even if you curb the number of follow-up questions you include, testing multiple concepts can lead to respondent fatigue, jeopardizing your data quality.
With all that in mind, we would suggest using a sequential monadic design if:
![]() There are several concepts you need to test- usually, this is the case during early rounds of testing when you need to screen a batch of ideas without a large panel.
There are several concepts you need to test- usually, this is the case during early rounds of testing when you need to screen a batch of ideas without a large panel.![]() You are limited by your schedule or budget.
You are limited by your schedule or budget.![]() There are only a few questions you need to ask about each concept.
There are only a few questions you need to ask about each concept.![]() You want to use significance testing to compare concept scores.
You want to use significance testing to compare concept scores.
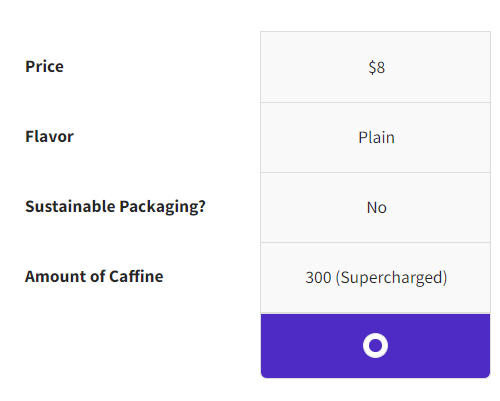
3. Give respondents some context.
No matter what type of concepts you're testing, it’s important for respondents to have a clear idea of what they are evaluating.
You can use any combination of text, images, or videos to give them clarity on what your concepts are exactly and what their purpose is.
If you are testing a product concept, describe the problems your product solves and why it’s better than other solutions on the market. Or, if you are screening ad concepts, explain where these ads will be placed- are they digital banner ads? Or will it be featured in a print magazine?
And make sure to avoid technical jargon or buzzwords. While it may make perfect sense to you and your team, it's likely to confuse your respondents.
4. Ask the right questions.
You’d be forgiven if the first question you ask is: Do you like this concept? But that shouldn’t be where you stop.
Of course, you’ll want to investigate the classics- like which elements respondents liked and disliked. But take the time to circle back to the goals and objectives you previously outlined to be sure that each key metric is evaluated.
If you want to know how appealing each of your ad concepts are and how they impact a consumer's purchase intent, you will need to include some questions on both.
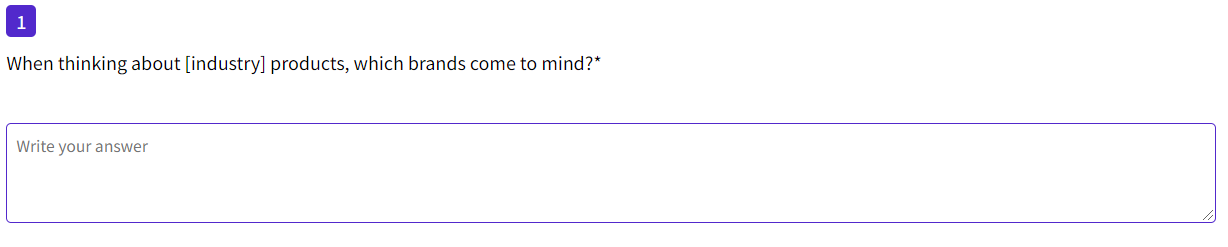
If you are looking to understand the associations that your product concept invokes, you might consider using an open-ended question. You can analyze the data with Natural Language Processing (NLP) for insights on common themes, topics, keywords, and sentiments.
5. Avoid hidden triggers of bias.
While we all know bias is detrimental to data quality, you might be surprised to learn some of the triggers.
One major trigger of bias comes from scale questions, specifically cases where you force neutral respondents to make choices that don't accurately reflect their feelings.
When using rating or Likert scale questions, you should always opt for a 5- or 7-point scale. This allows you to add a neutral option so that those who are indifferent or unsure can give authentic feedback.
Similarly, the way you word your questions and order the answer options can also trigger bias.
Make sure to use neutral language when writing your questions. And for your answer options, opt for randomization whenever possible. You could also consider adding a free-response option to your multiple-choice questions to capture any alternatives you might have missed.
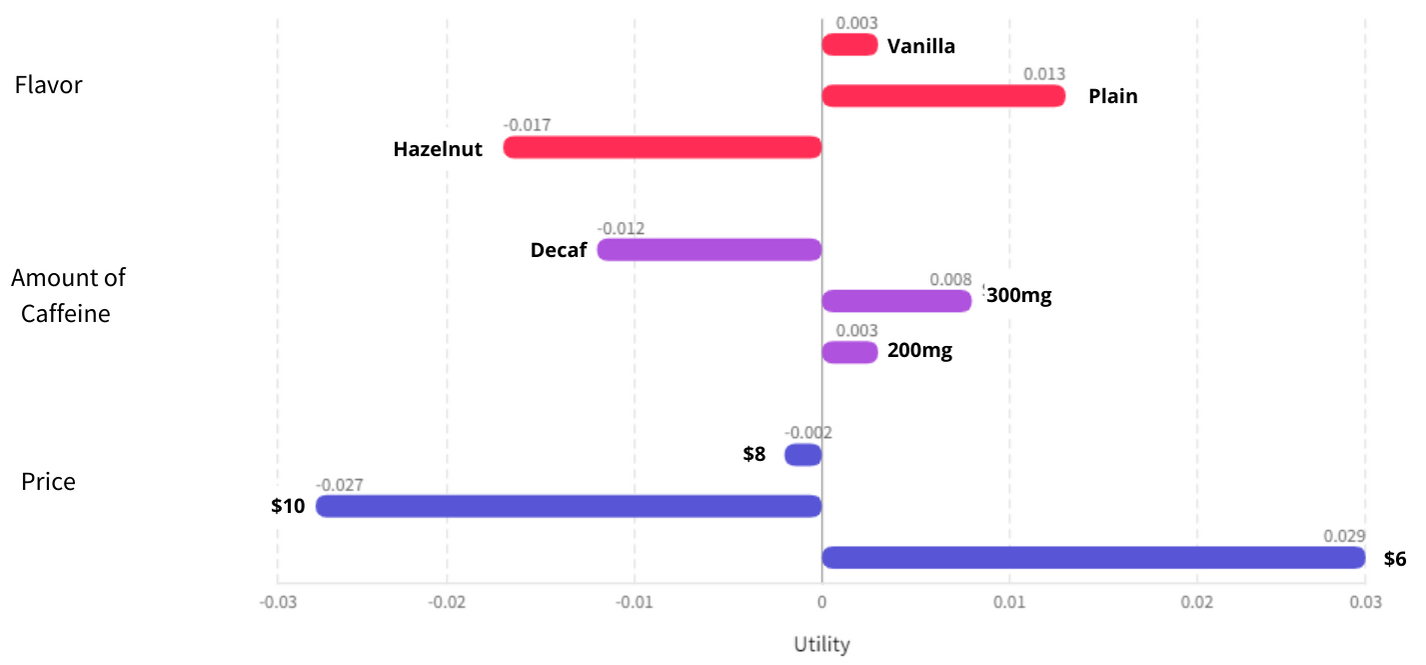
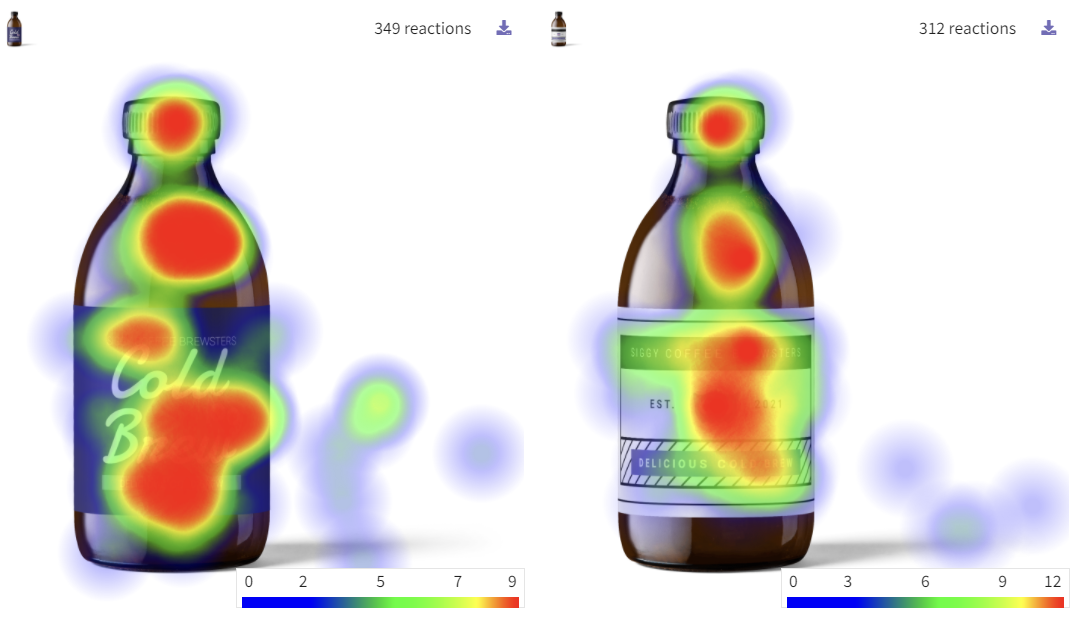
6. Get creative with heatmaps.
Heatmaps are an excellent tool for visualizing concept testing data. By adding them to your concept tests, you can get granular feedback on the specific areas that respondents liked and what wasn’t quite working for them.
Whether you are testing packaging, advertising, prototype, or shelf-placement concepts- you can't go wrong with heatmaps.
And while images may be an obvious use case, heatmaps also work well for copy. They allow you to see which areas were the most engaging to the reader and which may need a few more rounds of editing.
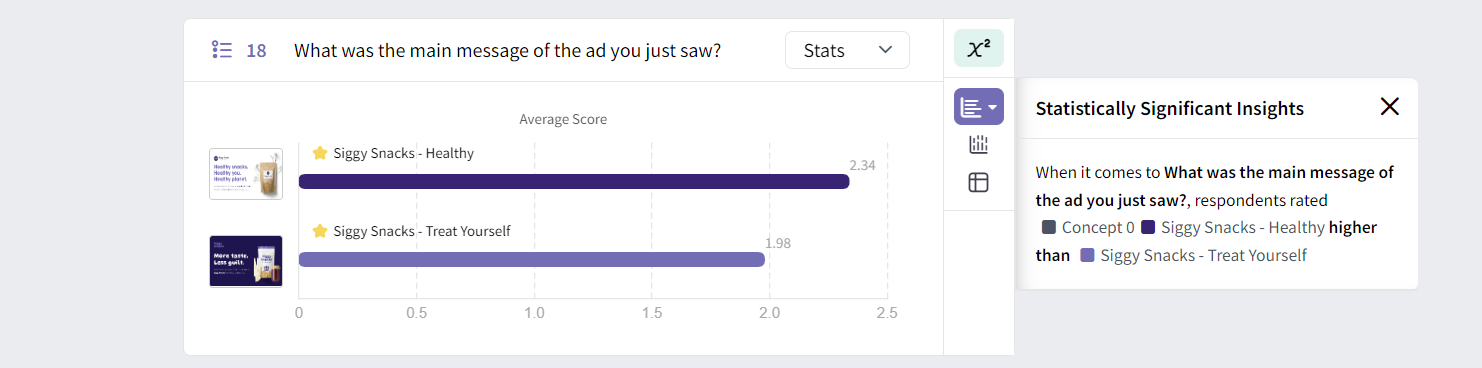
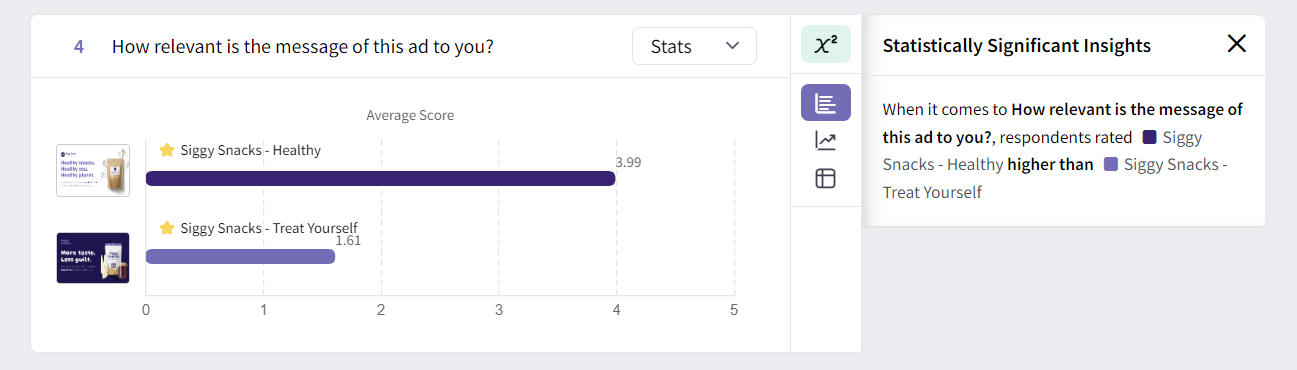
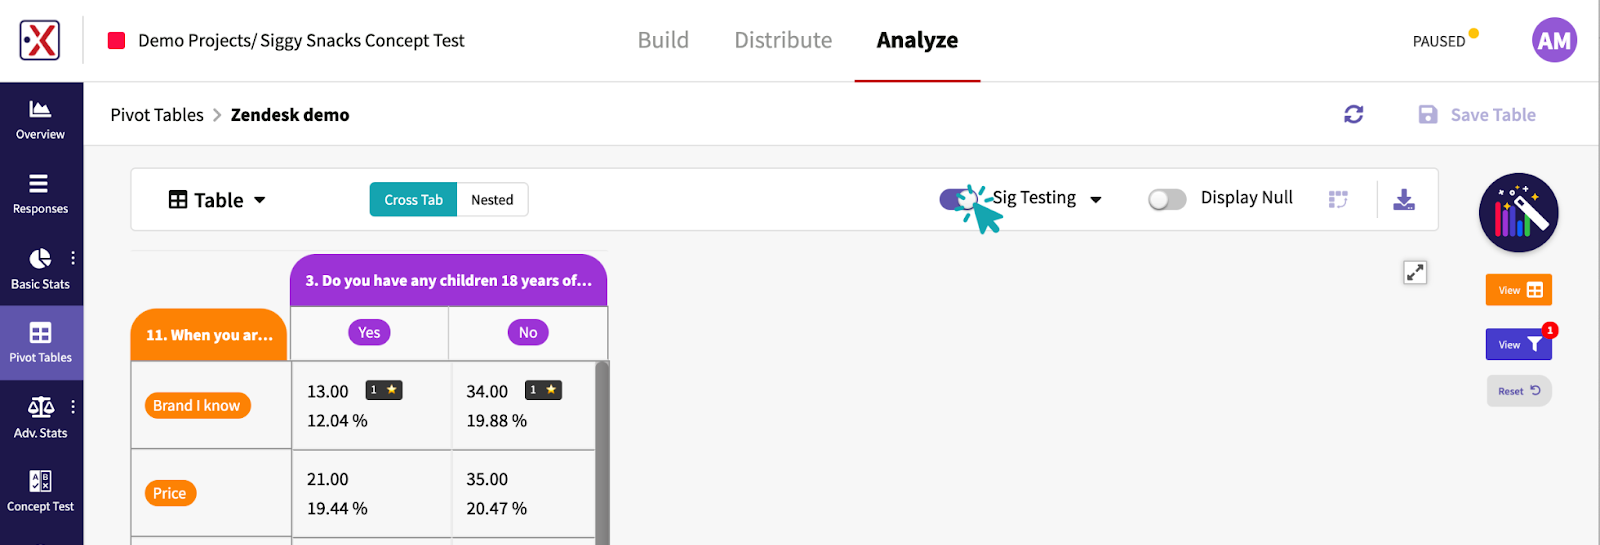
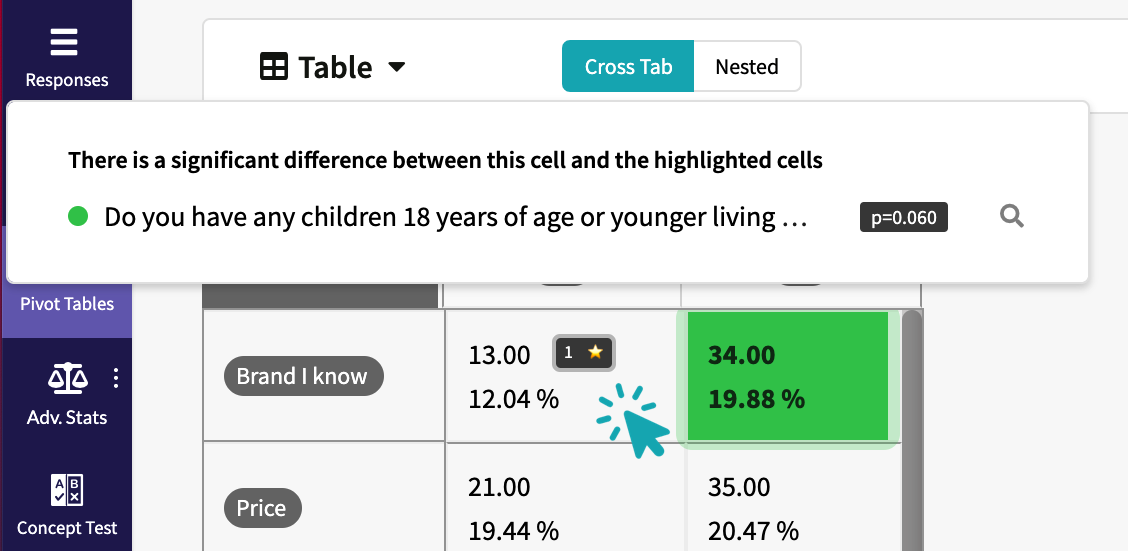
7. Use automated significance testing to pick out meaningful insights.
Sometimes concept tests won’t give you a clear-cut winner.
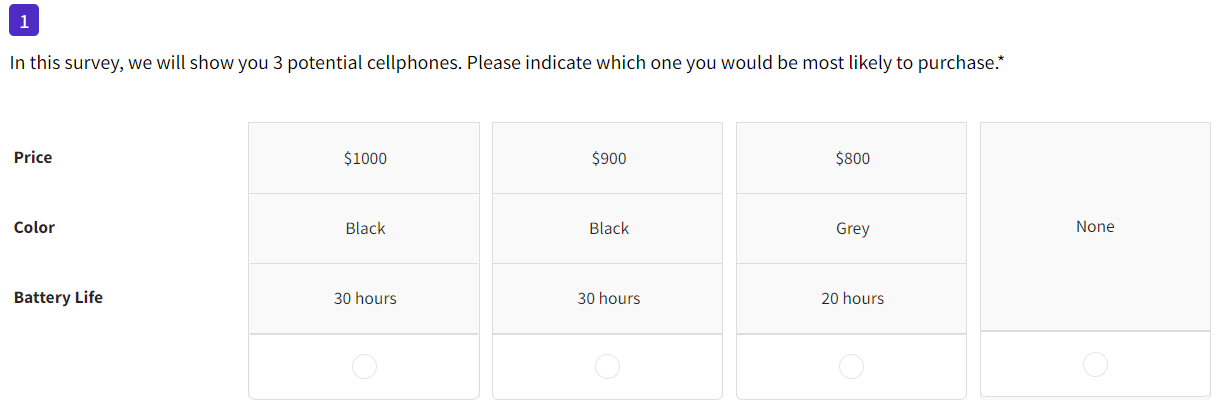
Let’s say you ran a concept test for your upcoming ad campaign. After exposing respondents to both ads, you asked them how likely they were to purchase your product.
But once the data came in, you found that 64% were likely to buy your product after viewing the first ad, while 72% said the same thing after seeing the second.
So you find yourself wondering, is that 8% meaningful? That's precisely why significance testing is so important.
No matter what your key metrics may be- from appeal to purchase intent scores- significance testing gives you a way to quickly and easily understand whether the slight differences in your data are in fact meaningful.
Concept Testing with SightX
The SightX platform is the next generation of market research tools: a single, unified solution for consumer engagement, understanding, advanced analysis, and reporting. It allows insights, marketing, and CX teams to start, optimize, and scale their insights workflow.
But, SightX isn’t just great tech our Research Services team knows all of the best practices, along with some tips and tricks for getting the best data out of your surveys.
Remove the guesswork from your current strategy by going directly to the source.
If you're ready to put your ideas to the test, start a free trial today!


 We always suggest using the industry standard 95% as the confidence level default. However, you can change your confidence level when needed in the SightX platform.
 .gif)

 Hidden Brain
 TED Radio Hour
  Conversations for Research Rockstars
 Ologies
 Snap Judgment: Spooked
.png)