
If you work in or around market research, you have most likely used or (at the very least) heard of conjoint techniques.
We will be the first to admit that literature on the topic is often intensive and can feel overwhelming for those unfamiliar with the ins and outs of conjoint analysis.
But, this doesn’t have to be the case.
While the SightX platform can automate your curiosity and research projects, it's still crucial to understand the methodologies you use.
To save you from sinking into a technical white paper, we’ve compiled some of the most common questions we get about conjoint analysis.
What is Conjoint Analysis?
The concept itself is quite simple.
Conjoint analysis is a market research approach that measures the value consumers place on the features of a product or service. It does this by uncovering the rules consumers explicitly (and implicitly) use to make their purchasing decisions by mimicking the real-world trade-offs made when shopping.
History of Conjoint Analysis
Now for some backstory.
You can trace conjoint analysis back to the 1960s, having been created by mathematical psychologists and statisticians Luce and Tukey (1964). The two published an article exploring how measuring the goodness of specific characteristics of an object could enable one to measure the goodness of an object as a whole.
Professor Paul Green would later realize the marketing implications of this work; believing it could help marketers understand how buyers make complex purchasing decisions and ultimately predict shopper behavior.
This would eventually lead to Green coauthoring a historic article with Vithala Rao which detailed the first consumer-oriented approach for the methodology.
Throughout the decades since, conjoint analysis has evolved and become increasingly popular within the marketing research industry.
What is the Purpose of a Conjoint Analysis?
Conjoint analysis has many purposes, but it is most commonly used to uncover consumer preferences about your product to predict adoption, gauge price sensitivity, choose the optimal set of features, and project market share.
The most popular use for conjoint analysis is generally within product development, helping brands find the perfect set of product features and messaging points for their target market.
Conjoint analysis is an incredibly versatile methodology and can be used across most industries for products ranging from vacation travel packages to consumer packaged goods.
When Should I Consider Conducting a Conjoint Analysis
When it comes to making a purchase, consumers often consider a variety of product features
These features can be referred to as product "attributes", with each "attribute" having several levels or options.
To illustrate, let’s use an example: A major automobile manufacturer is considering adding a new car to its lineup. While they have some ideas for the new vehicle, they want to know what consumer would be most willing to purchase. So, they decided to run a conjoint analysis to explore three attributes.
The first attribute is car's color, making the choices of color the attribute levels (black, white, or grey). Another attribute is the car's price ($25K, $35K, $45K). And the third attribute is the energy type the car uses (gas, hybrid, or electric).

A conjoint analysis will show the company which attributes matter most to consumers, the levels that are most popular, and what the optimal combination to maximize sales.
Steps to Doing a Conjoint Analysis
Running your conjoint analysis is much easier than you'd think! Just follow these simple steps:
Identify The Attributes
The first step is to gather the product attributes you want to test. In this case, "attributes" refer to the features of the product.
While it can be easy to get yourself wrapped up in the minutia of your product, keep in mind that less is more here.
Adding too many attributes to your conjoint experiment will only make it more difficult for respondents to accurately assess your product features. Generally, we would suggest you keep your number of attributes near 3.
Set Your Levels
While "attributes" are the features themselves, "levels" are the options related to each attribute you're testing.
Similar to the attributes, adding too many levels to your experiment will create a heavy cognitive load for respondents and may even overwhelm them. So again, less is more here. We would generally suggest no more than 4 levels per attribute.
Input Your Information into SightX
While there are certainly manual methods of creating a conjoint analysis, automation can be a HUGE timesaver.
After you have gathered your attributes and levels, you can easily create a conjoint experiment within the SightX platform by selecting "Conjoint" from the methodologies menu.
You can include a description with instructions for respondents, giving them a brief background on the category or types of products they will be evaluating. You can also add images to make the process more engaging.
With the details you input, the SightX platform will generate a balanced experiment.
Choose a Sample Size and Launch Your Experiment
Once the experiment is ready for launch, it's time to consider your sample. It's important to include a sufficient number of respondents in your conjoint experiments, you can use our handy Conjoint Sample Size Calculator to determine the right sample size for your project.
Once you know the sample size required for your conjoint analysis, you can launch your project to begin gathering data.
As for the analysis, we'll cover that below:
Outputs of Conjoint Analysis
Once you've collected data, your conjoint analysis graph will look something like this:
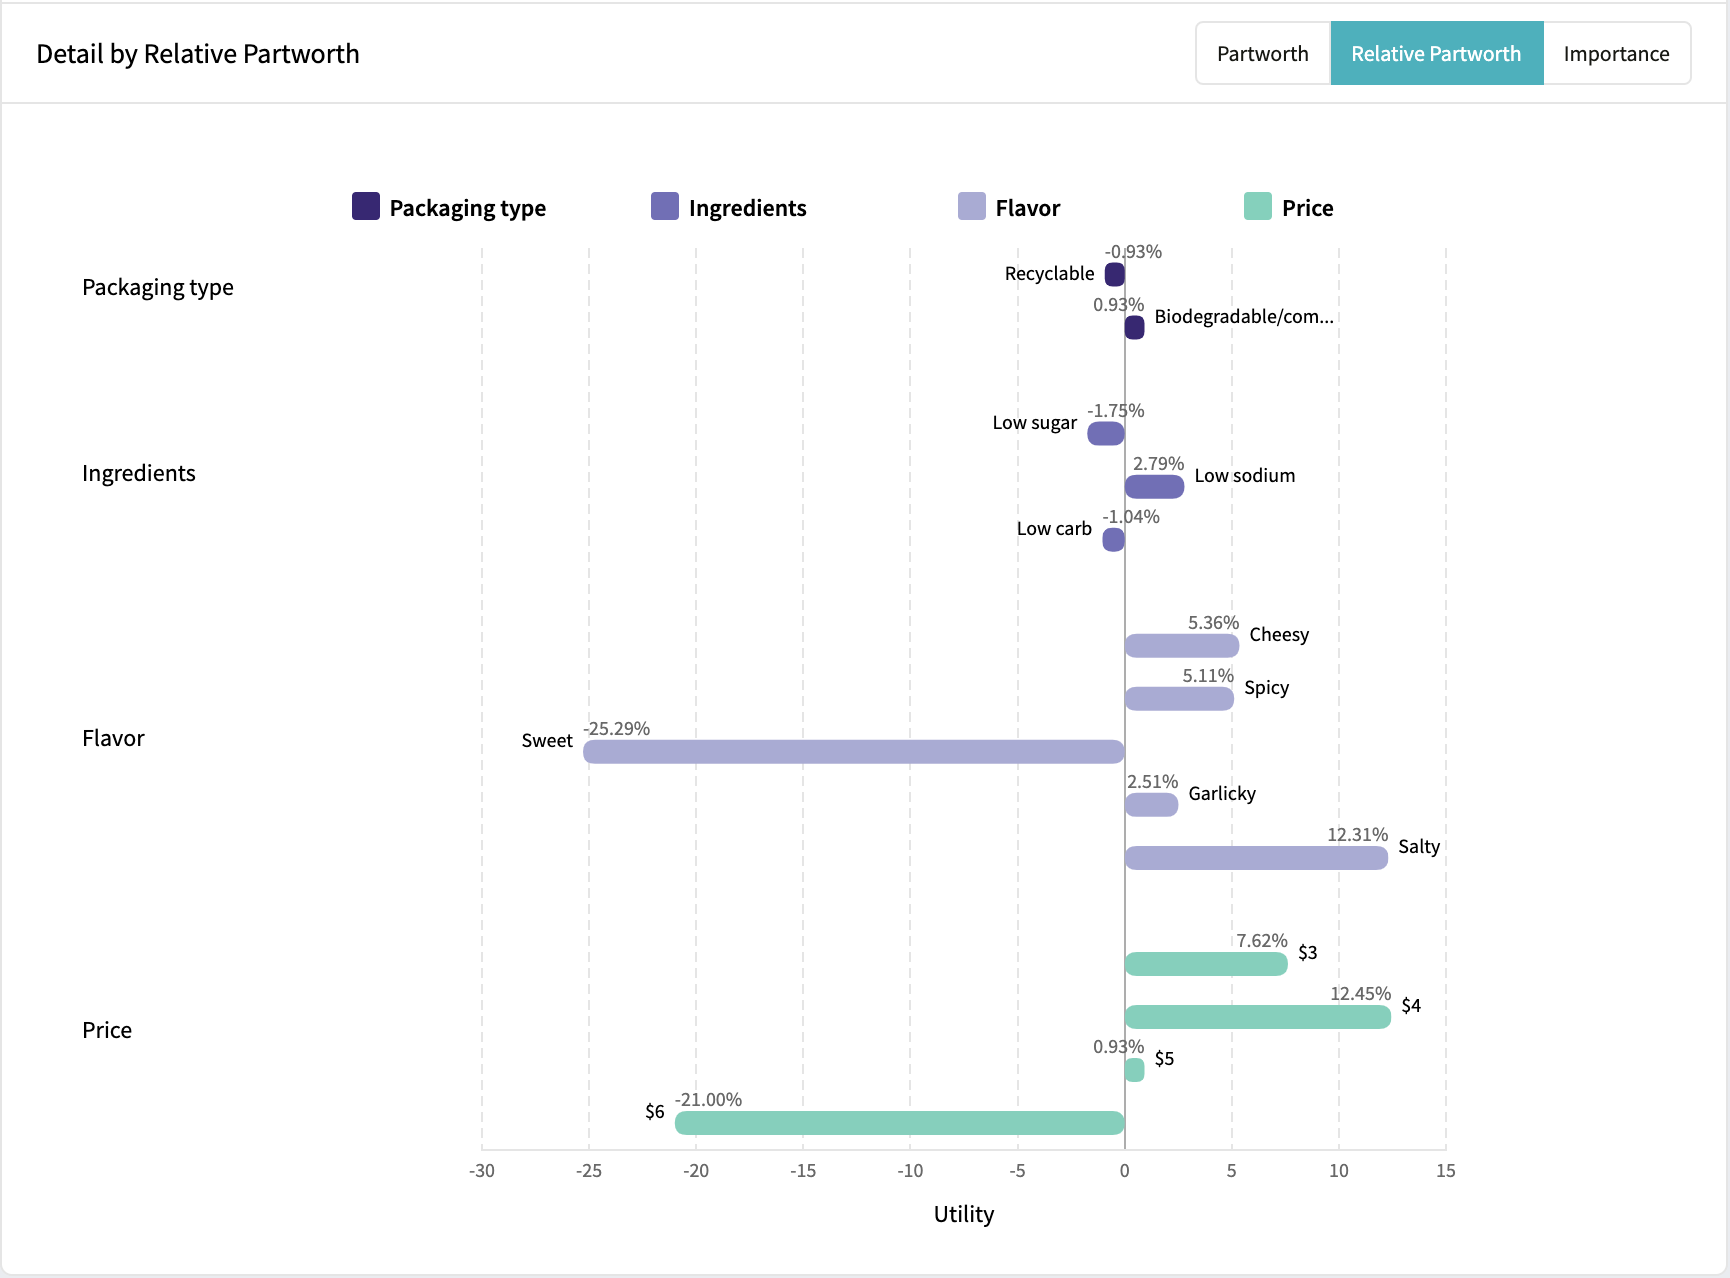
The graph above will not only show you the importance of each attribute but also the popularity of each level within the attributes. Ultimately this data will help you better understand the optimal package of features for your product.
SightX provides three types of conjoint data analysis: Part-Worth, Relative Part-Worth, and Importance. You can toggle between the three on your graph.
What is Part-Worth and How Does it Relate to Conjoint Analysis?
While several estimation models are listed above, the most widely used is the Part-Worth model.
Unlike the other models, it does not make any prior assumptions regarding the utility caused by a specific level of any attribution. Simply put, the outcomes will be a more accurate depiction of consumer preference.
In your product research, you will see that multiple attributes come together to define the total worth of a product. And some may be more important to consumers than others.
Part-worth is the estimate of the overall value (or utility) associated with each attribute and level used to define your product. So, the values of each separate attribute are the part-worths.
There are several research techniques to estimate part-worth. The most widely used are Latent Class Analysis and Regression modeling based on Hierarchical Bayesian (HB).
The values of the part-worth utilities provide information on how attractive attribute levels are. Remember the example of car types across various price points and colors?
If you want to know the relative importance of each attribute, you will need to calculate Attribute Importance by determining how much difference each attribute can make in the total utility of a specific product. That difference is the range in the attribute's utility value.
You can calculate percentages from relative ranges, obtaining a set of attribute importance values that add up to 100. The higher the percentage is, the more important the feature.
In the end, you can discern which features should be combined for the most impact- ideally, you are working with a software platform that automates this process for you.
What is the Link Between Conjoint Utility Scores and Market Share?
In addition to those insights, you may be interested in taking your utility scores and using them to simulate market share, where a market simulation provides information on the relative share of respondents who prefer predefined products in a certain context.
Simulating market share enables researchers to test various scenarios and assess factors like price demand curves, the impact of product adjustments, and the competitive landscape.
The first step in conducting a market simulation begins with specifying relevant products. The total utility of these products is computed at the individual or target level- the total product utility being the sum of its part-worth utilities (Green and Krieger, 1988). From there, consumer insights leaders can compare the total utility value of products to that of a “none of the above” option.
The larger the difference between the total utility score of an alternative and the utility score of the “none of the above” option, the more likely it is for users to accept the alternative. Conversely, if a product's total utility score is below the “none of the above” option, it indicates that the users are not likely to accept the offering.
Researchers can apply the logit model to estimate market share. Market share is predicted by simply exponentiating the total utility and then dividing this value by the sum of all products’ exponentiated values and that “none of the above” option. Here is the formula:
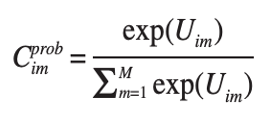
If, like most people, you’re a bit scared off by formulas, have no fear!
Conjoint analysis is simply the mathematical representation of what we covered in the paragraph above: “Market share is calculated by exponentiating the total utility of a product and then dividing this value by the sum of all products’ exponentiated values and the “none of the above” option."
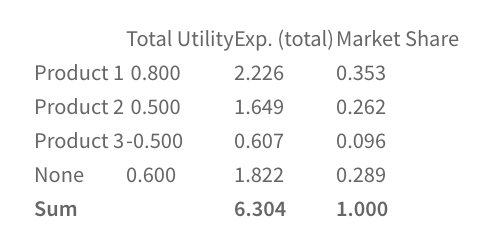
The calculation can be done using a basic calculator equipped with an “EXP” (or ex) button.
Below is an example with total utility scores, exponential scores, and the market shares associated with it.
While the overview above should prove helpful, we understand that these concepts can be technically challenging.
SightX allows you to automate conjoint analysis, helping you to more easily optimize your product development and forecast the likelihood of market acceptance. Our step-by-step setup enables you to launch projects within minutes and instantly analyze results with real-time analytics.
Companies Using Conjoint Analysis
Conjoint analysis is an incredibly popular tool for organizations of all shapes and sizes. Some recognizable names include:
![]() NBC Universal Parks & Resorts have used conjoint analysis when designing their theme park experiences.
NBC Universal Parks & Resorts have used conjoint analysis when designing their theme park experiences. ![]() Proctor & Gamble have relied on conjoint analysis for insights on messaging, pricing, and design for their CPG products.
Proctor & Gamble have relied on conjoint analysis for insights on messaging, pricing, and design for their CPG products. ![]() Apple used conjoint analysis to estimate the economic cost of patent infringements by their competitor Samsung.
Apple used conjoint analysis to estimate the economic cost of patent infringements by their competitor Samsung. ![]() Bose has used conjoint analysis in their product development cycle and when extending their product lines.
Bose has used conjoint analysis in their product development cycle and when extending their product lines.
Share this post