Market Research and Retail: How to use consumer insights to thrive
Whether you're a retail behemoth or a smaller brand making its first foray into the retail landscape, understanding your target market is crucial for success.
But trying to find the perfect match between customers, products, and prices is like trying to find a needle in a haystack.
This is precisely why so many retail brands turn to market research.
By collecting insights on consumer preferences, competitors, and industry trends, retailers can gain valuable insights that help them drive growth and create their own competitive advantage.
What is Market Research?
Before we dive into the details, let's cover the basics.
While there are many types of market research, today we'll focus on primary market research- the process of collecting and analyzing consumer data, commonly through surveys and experiments.
Its purpose is to examine the market and perceptions surrounding a product, service, or brand. Ultimately providing the insights needed to perfect products, tailor marketing campaigns, and drive positive customer experiences.
By conducting market research, retailers can gain valuable insights into their target market, which can be used to improve product offerings, customer service, and marketing strategies.
What are the Benefits of Market Research for Retail?
From new products to emerging trends, the retail industry is ever-evolving.
To thrive in a competitive environment, you'll need to understand the market. Specifically, what consumers are actually looking for, what your competitors are offering, and how you can stand out.
Market research can act as the connector between you and your target market- showing you who your customers are, what they want, where they shop, and (most importantly) why.
Here are just a few of the perks:
Find your target market
No matter how multi-faceted your retail brand might be, it's impossible to appeal to every type of consumer. Instead, you'll need to target an audience receptive to your brand and products. Using data points on interests, preferences, purchase intent, shopping behavior, and more- you can create an accurate profile of your ideal consumer and uncover ways to reach them effectively.
_Size=sm)_Color=Success.png) Enhance customer experience
Enhance customer experience
The best way to understand your customers' experiences is by asking them directly. By collecting customer feedback through surveys, you can quickly identify areas for improvement.
Identify emerging trends
Things can change quickly in the retail sector. By keeping in close contact with your target market through surveys and tracking studies, you can spot trends early- helping you stay one step ahead of your competitors.
Improve your marketing
Through market research, you can gain a better understanding of what their customers want, what motivates their purchasing decisions, and what factors ultimately drive brand engagement. Allowing you to craft expertly-targeted marketing campaigns that drive ROI.
Increase revenue
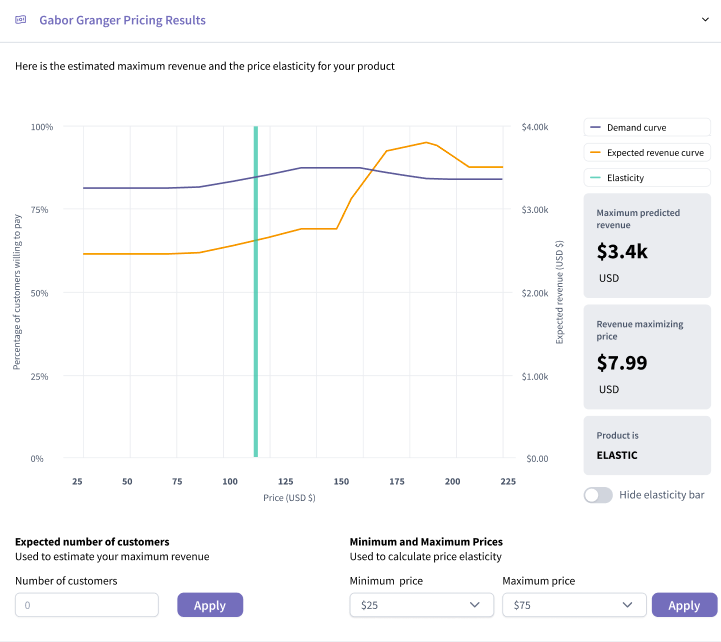
By understanding what customers are willing to pay for products, retailers can optimize their pricing strategies to maximize revenue without compromising their demand.
Ways to Use Market Research in Retail
Product Development
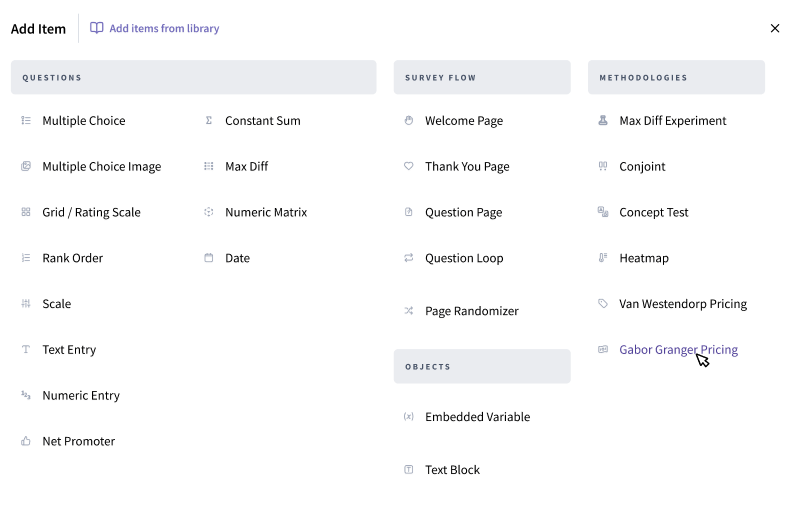
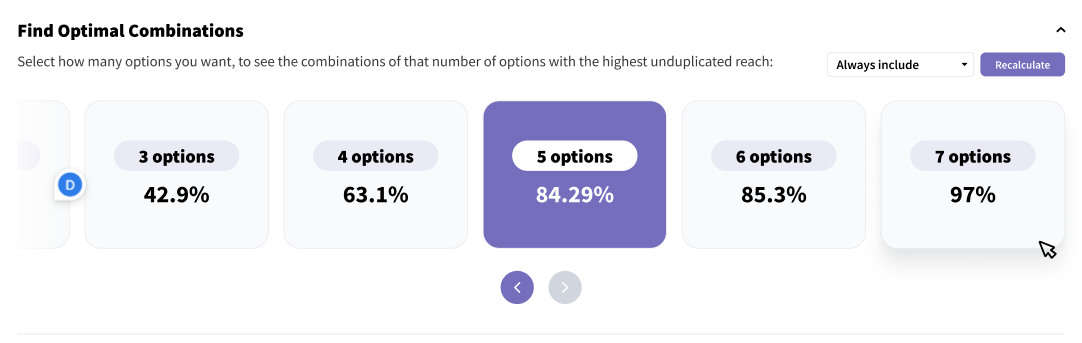
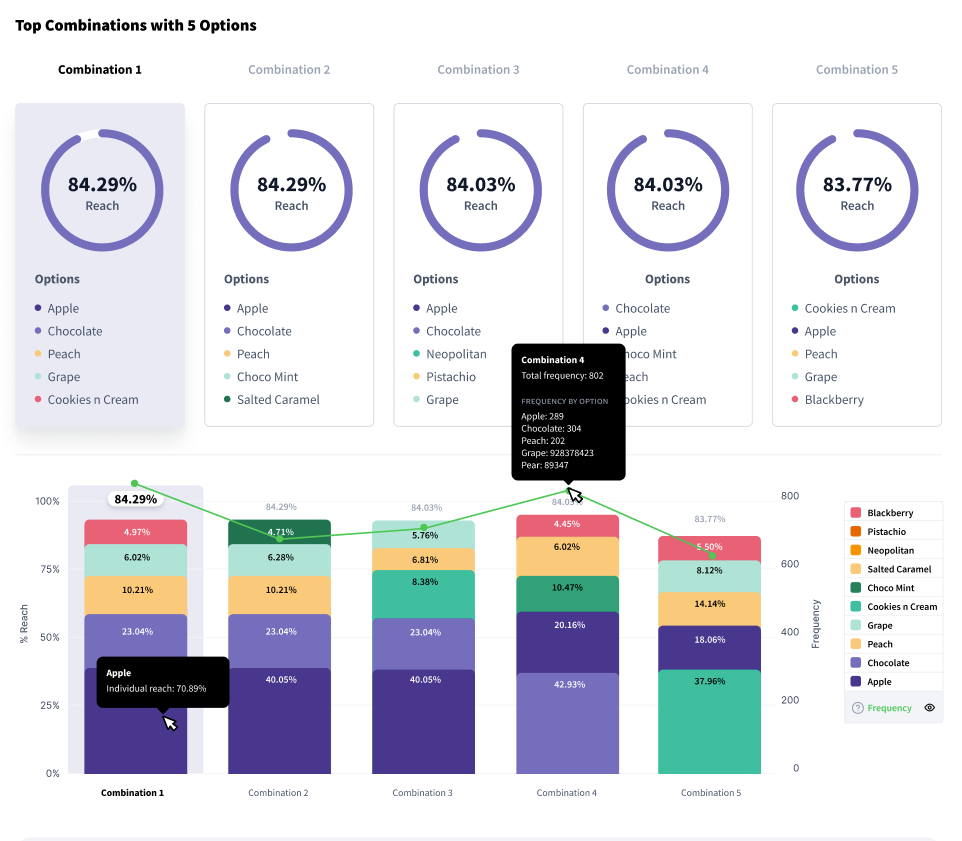
Retail companies can use market research to determine what types of products consumers are looking for, what features matter most, and new opportunities for innovation. Tools like concept tests, conjoint analysis, TURF, and MaxDiff can help retailers when developing new products, or modifying existing ones to better meet customer needs.
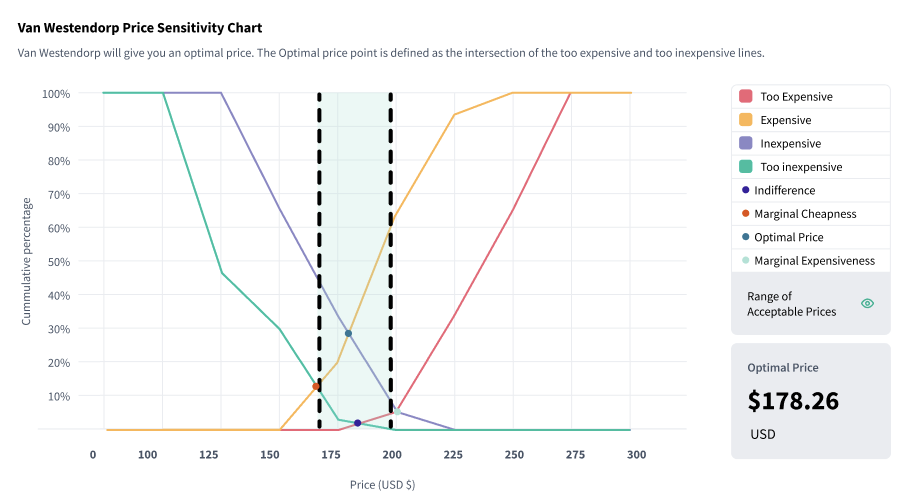
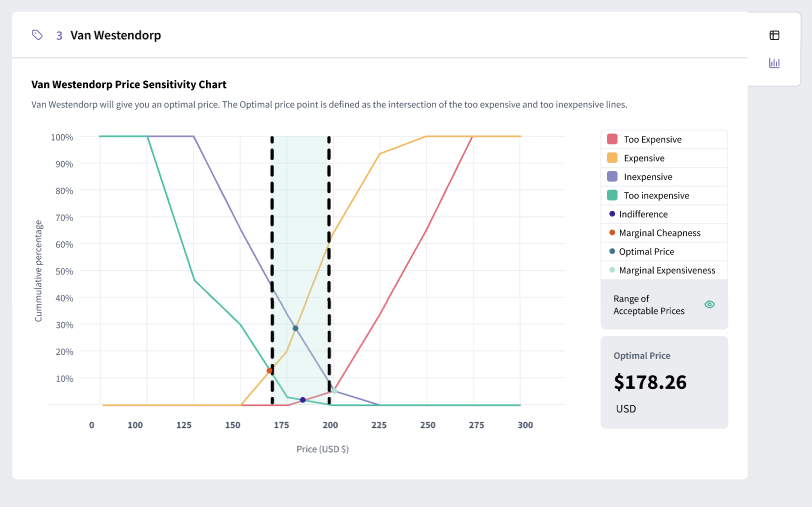
Pricing Strategy
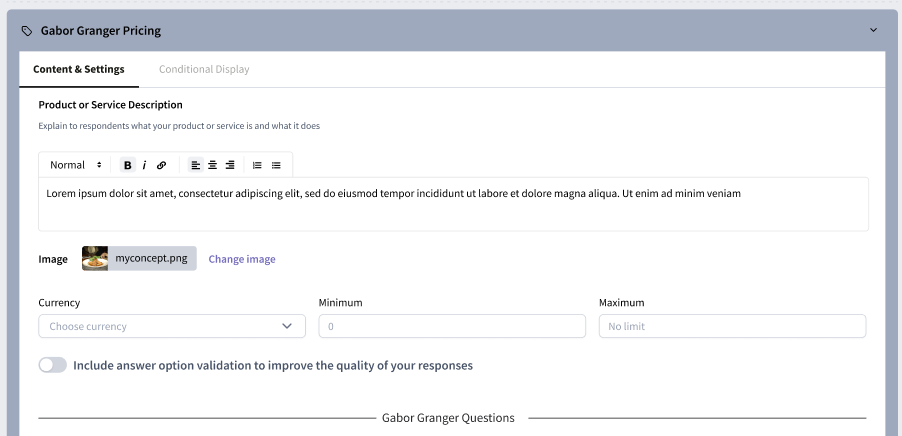
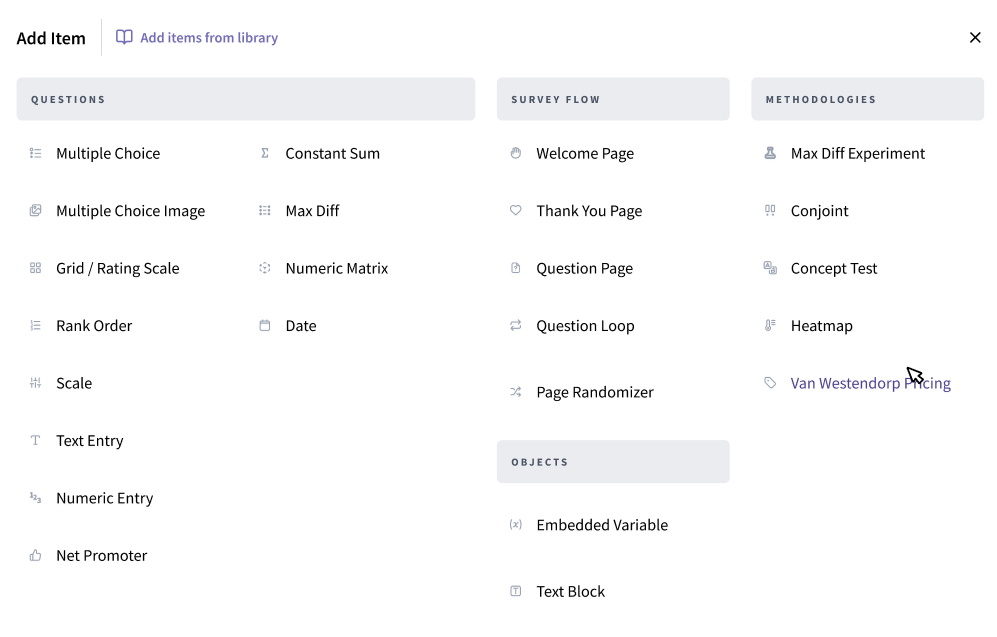
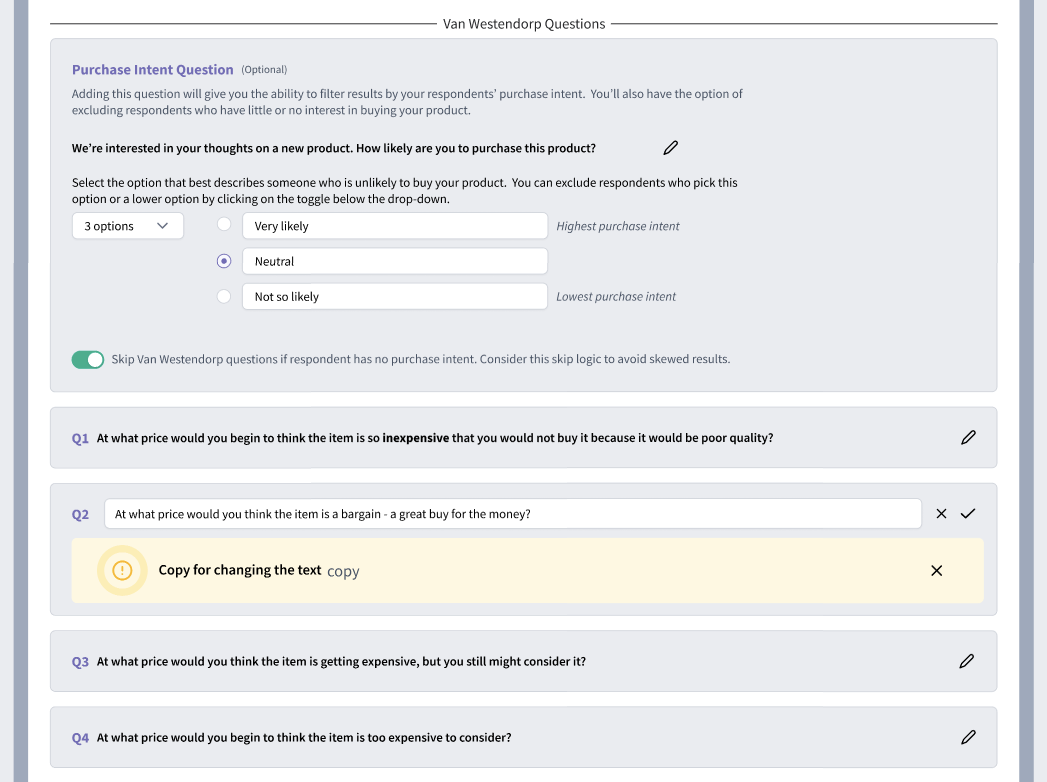
Research shows that even a 1% improvement if your pricing can increase profits by 11%. Using pricing studies like Van Westendorp or Gabor-Granger will give you an optimal price point that maximizes revenue without compromising demand.
Customer Profiling
Segmentation analysis helps you better understand the buyer personas in your category, giving you insights into their purchasing behavior and preferences. These insights can help you improve everything from customer experience to advertising campaigns.
Customer Satisfaction
Keeping customers happy isn’t always easy. But by using tools like Key Driver Analysis you can find ways to improve their experience, drive loyalty, and raise retention rates.
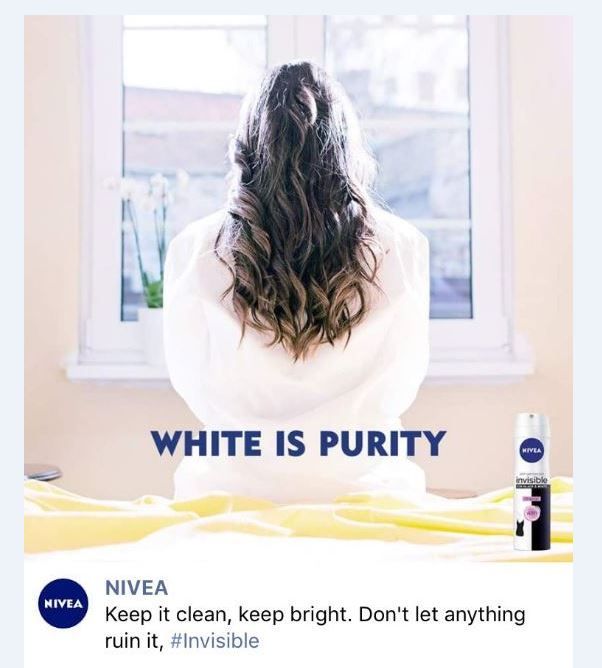
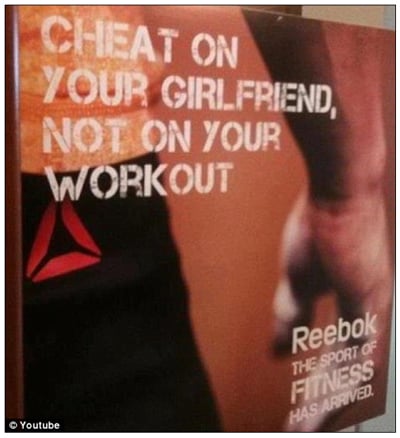
Brand Perception
Your brand is one of your most valuable assets, so you can't just leave its health up to chance! Using brand tracking studies, you can discover how people perceive your brand and where you are positioned compared to the competition. The insights can be used to enhance your brand messaging, packaging, and advertising campaigns to better resonate with your audience.
Retail Market Research with SightX
The SightX platform is the only tool you'll ever need for market research: a single, unified solution for consumer engagement, data collection, advanced analysis, and reporting. While powerful enough for insights teams at Fortune 500 companies, the user-friendly interface makes it simple for anyone to start, optimize, and scale their research.
Plus, with SightX's research team, you can gain access to the best thinking in the insights field. Our in-house experts will guide you through every step in the market research process, from survey scripting to analysis support, and everything in-between.
If you're ready to dive into market research, get started today for free!