Pricing is a crucial factor that often determines the success (or failure) of an offering. But without solid data on what consumers are willing to pay, businesses are left with best guesses and gut feelings.
That's why many organizations turn to market research methodologies like Van Westendorp's Price Sensitivity Meter to create a pricing model driven by customer data. Here's how it works:
What is Van Westendorp?
Since its introduction in the 1970s, the Van Westendorp Price Sensitivity Meter has been a popular pricing methodology used in market research.
Instead of simply asking consumers to identify a dollar amount, this experiment evaluates a range of acceptable prices for your product and offers an optimal price point. It does this by asking four key questions:
![]() "At what price would you begin to consider the product so inexpensive that you would question the quality and not purchase it? "
"At what price would you begin to consider the product so inexpensive that you would question the quality and not purchase it? " ![]() "At what point would you think the product is a bargain?"
"At what point would you think the product is a bargain?" ![]() "At what price would you say this product is starting to become expensive- to the point that you’d have to give some thought to buying it? "
"At what price would you say this product is starting to become expensive- to the point that you’d have to give some thought to buying it? "![]() "At what price point would you consider the product to be so expensive that you wouldn’t consider buying it?"
"At what price point would you consider the product to be so expensive that you wouldn’t consider buying it?"
While the questions themselves are quite simple, the output is powerful.
After running a study, the visualization will reveal an acceptable range of prices (highlighted in green in the visualization below).
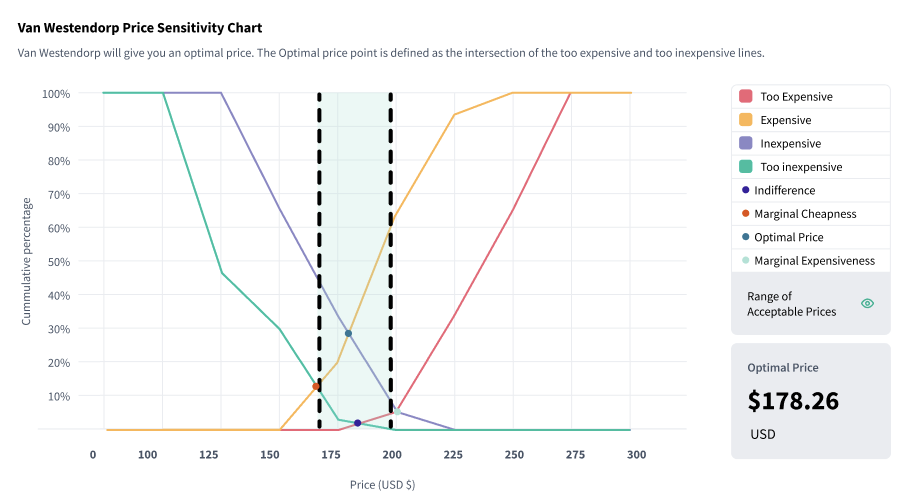
This range of prices is end-capped by the point of marginal cheapness (PMC) on the left and the point of marginal expensiveness (PME) on the right. If you price your offering any lower than the PMC, shoppers would likely find your product too cheap and question the quality. Similarly, any price above the PME would be considered too expensive for most of your market.
But that’s not all it will show you.
Directly in the center, you will see the intersection of the “too cheap” and “too expensive” lines. This is your optimal price point.
What makes it optimal? It minimizes the number of people who are dissatisfied with your price one way or the other.
While there are many pricing methodologies to choose from, we would recommend using a Van Westendorp for your pricing if:
![]() You don’t have a price range for your offering and would like to explore your options.
You don’t have a price range for your offering and would like to explore your options. ![]() You would prefer to run a simpler study that will yield straightforward results.
You would prefer to run a simpler study that will yield straightforward results.
If you already have a price range, but are looking to find your optimal price point- check out our blog on Gabor-Granger.
Van Westendorp with SightX
With SightX, gauging price sensitivity and solidifying an optimal pricing strategy is simple.
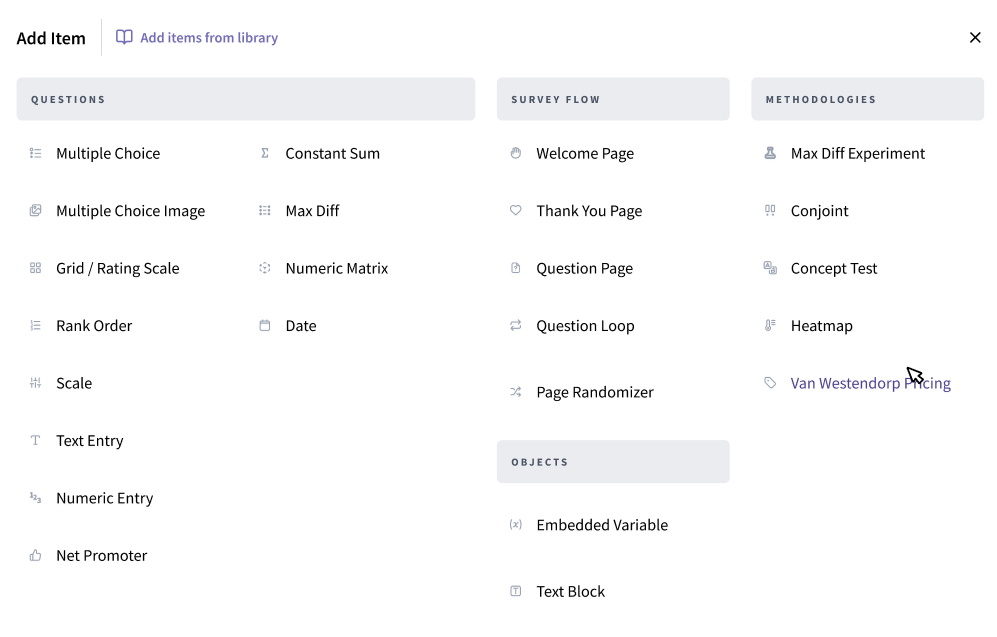
After creating a new project, you’ll start in the BUILD section. There you can select “Van Westendorp Pricing” from the add item menu.
The experiment will immediately populate, giving you space to add a description and image of your product or service. You can also set a currency and minimum and maximum prices if you have them.
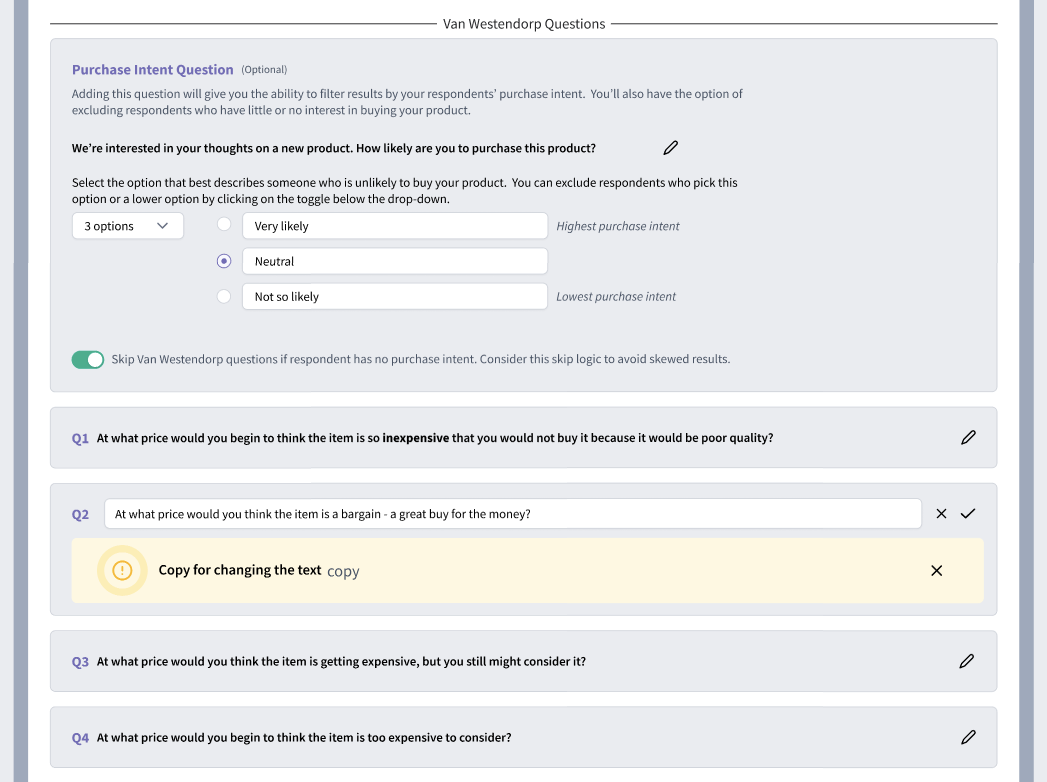
Below, you’ll find the study. The first question we suggest is a purchase intent screener. This question allows you to disqualify respondents who have little or no intent to purchase your product.
From there, the four Van Westendorp questions are pre-filled and set for launch. You’ll just want to include a welcome page and some demographic questions.
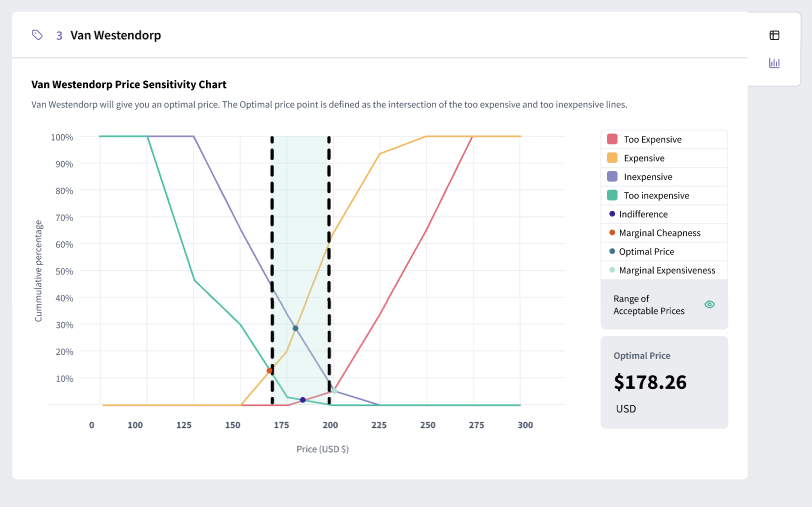
After you’ve fielded your survey and gotten the results, you'll see something like the graph below. The green box in the center of the graph highlights the range of acceptable prices.
On the left, you'll see a red dot that indicates the point of marginal cheapness (PMC). On the right, you'll see a green dot indicating the point of marginal expensiveness. And directly in the center of highlighted area is your optimal price- also displayed to the right of the graph.
Evaluate Price Sensitivity with SightX
If you’re ready to level up your insights, we’ve got the tools to make it happen!
The SightX platform is the next generation of market research tools: a single unified solution for consumer engagement, understanding, advanced analysis, and reporting.
But, SightX isn’t just great tech. Our Research Services team knows all of the best practices, along with some tips and tricks for getting the best data out of your surveys and experiments.
Remove the guesswork from your strategy by going directly to the source. Get started for free!
Share this post