
Conjoint analysis is a well-known technique in market research used to better understand how people make decisions.
It does this by presenting them with hypothetical- yet realistic- buying situations to track their preferences and measure where they place their value.
Conjoint is frequently used across the insights space for everything from product and price optimization to marketing claim refinement.
However, building a conjoint experiment that gives you the highest quality data can be difficult, no matter how much experience you have. So we had our in-house research experts share some of their best practices for a better conjoint analysis.
But, before we dive into the nitty-gritty- let's define a few terms we'll be using:
![]() Attributes-These are more commonly known as the features of your product or service. They are the aspects of your offering that will be evaluated by respondents. For example, the attributes of a cell phone could be price, color, size, camera quality, durability, battery life, or brand.
Attributes-These are more commonly known as the features of your product or service. They are the aspects of your offering that will be evaluated by respondents. For example, the attributes of a cell phone could be price, color, size, camera quality, durability, battery life, or brand.
![]() Levels- These are simply the options related to each attribute that you will be testing. Continuing the example above, you may want to understand the value people place on the number of hours the battery lasts, the camera quality, or color of the cell phone itself.
Levels- These are simply the options related to each attribute that you will be testing. Continuing the example above, you may want to understand the value people place on the number of hours the battery lasts, the camera quality, or color of the cell phone itself.
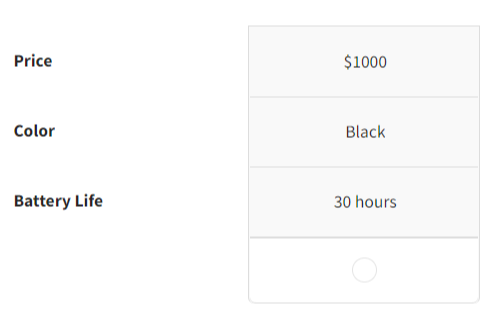
![]() Profile or Card- This is the hypothetical product (or service) offering generated during the experiment. It’s the total package of your attributes with randomized levels displayed. The image below is one profile for our cellphone example, if we chose to dig into the price, color, and battery life options.
Profile or Card- This is the hypothetical product (or service) offering generated during the experiment. It’s the total package of your attributes with randomized levels displayed. The image below is one profile for our cellphone example, if we chose to dig into the price, color, and battery life options.
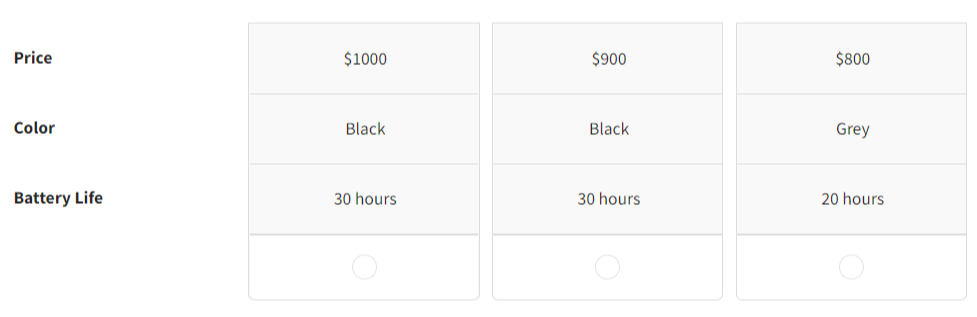
![]() Sets- This is simply the combination of multiple cards. A set a profiles is what is shown to your respondents when they are asked to choose their preferred package, like the example below:
Sets- This is simply the combination of multiple cards. A set a profiles is what is shown to your respondents when they are asked to choose their preferred package, like the example below:
Now that we’re all on the same page, let’s dive in!
Most Used Types of Conjoint Analysis
While there are many types of conjoint analysis, you’ll find that choice-based (CBC) and adaptive (ACA) are the most widely used in market research.
Choice-based conjoint analysis (also known as discrete-choice conjoint analysis) is by far the most common method- used for most pricing, product, and marketing studies. And that's because it works well at evoking real purchasing decisions from respondents.
Here’s how it works- your respondents are shown a set of 2-3 cards, each with the same set of product attributes (aka features) BUT with randomized levels for each attribute. It’ll look something like the image below:
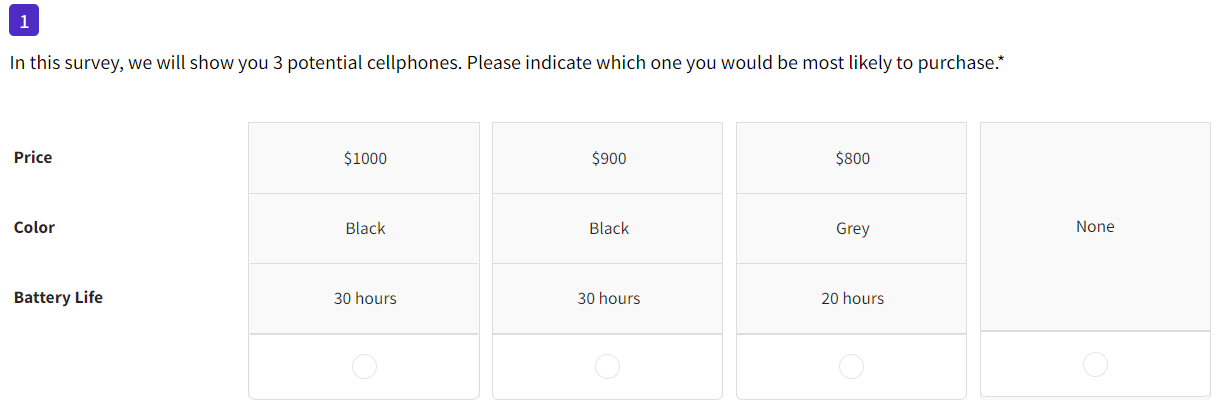
Respondents are asked to select which of the cards they would choose in real life- and if none of them are appealing, they can select the “none” option.
This will repeat, testing out various profiles with different attribute levels. The output will give you insight into the importance of each individual attribute and level. It will also help you discover the optimal way to package your attributes to capture the largest market share.
Adaptive conjoint- on the other hand- works a bit differently. As the name suggests, it adapts based on the choices respondents make. Because it targets peoples' most preferred attributes and levels, it makes the process a bit more efficient for larger or more complex studies.
The SightX platform and research team most often work with choice-based conjoint analysis. So, our tips will be focused on this method.
Our Top 6 Tips for a Better Conjoint Analysis
1. Keep Your Profiles Simple & Straightforward
Often, it’s easy to find yourself wrapped up in the minutia of your product. So much so that we end up adding way too many attributes and levels to our experiments.
So, take it from us- less is more.
Adding too many attributes and levels to your experiment will create a heavy cognitive load for your respondents and eventually overwhelm them. Once that “analysis paralysis” sets in, they’re much more likely to lose focus and choose options at random.
Generally, we recommend narrowing your attributes and levels down to a simple 3x3 or 3x4- which is 3 attributes and 3 or 4 levels per attribute.
If you choose to add additional attributes and levels on top of that, you'll need a larger sample size. But, we’ll dig into this in our next tip…
2. Choose the Right Sample Size
Like any other survey, you’ll want to make sure that you have the right sample for your experiment. But unlike other surveys, you’ll need to account for a few extra- yet critical- factors.
We would suggest using this formula:

q stands for the number of sets you plan to show each respondent.
a is the number of attributes per set.
c is the maximum number of levels for any attribute in your experiment.
So, let’s say you plan to show 6 sets to each respondent (q)
Each set has 3 attributes (a)
And the maximum number of levels in any of the attributes is 10 (c)
Your calculation would look something like this:

Which means your minimum sample size is 556.
If you're not one for formulas, have no fear! Use the link below to access our conjoint analysis sample size calculator for Google Sheets. This tool will give you the preferred and minimum sample size for your unique project.
Free Conjoint Analysis Sample Size Calculator
3. Select Your Attributes & Levels Thoughtfully
Try not to test levels that lack a meaningful difference- like prices of $20, $21, and $22. Or colors like dark blue, navy, and indigo.
These options wouldn’t create indecision in the real world, and they likely won’t show you anything significant data-wise.
So take your time and carefully consider the attributes and levels you include in your experiment.
4. Optimize Your Experiment Length
“How many sets should I include in my experiment?”
This is one of the most frequent questions we get on conjoint analysis.
While you need enough sets to force choices, you also don’t want to overload respondents and create cognitive fatigue. Remember that the number of sets is really the number of conjoint questions you'll be having respondents complete.
Generally, we suggest 10 sets as the optimal number with 20 being the uppermost limit.
5. Limit Your Exclusions
In some cases, not every product attribute level will play well with others. In fact, some could actually contradict each other. If we continue our cell phone example from earlier- a low price paired with a long battery life and premium camera option is just not realistic.
While you may be forced to limit some pairings, keep in mind that this will affect the balance and randomization of your experiment- compromising the overall quality of your insights.
So, keep your exclusions to a minimum.
6. Keep It Engaging!
When building out your conjoint analysis, remember that you are attempting to mimic real-world decision-making. You’ll need to use the same sales and marketing language that people would encounter in stores.
Which is just a long way of saying: don't bog them down with the technical details!
You might also want to consider including imagery of your product or service upfront. Humans are visual creatures, and it helps if respondents can easily visualize what they would be buying when making a choice in your conjoint experiment.
Conjoint Analysis with SightX
The SightX platform is the next generation of market research tools: a single, unified solution for consumer engagement, understanding, advanced analysis, and reporting. It allows insights, marketing, and CX teams to start, optimize, and scale their insights workflow.
But, SightX isn’t just great tech, our research services team knows all of the industry best practices, along with some tips and tricks for getting the best data out of your respondents.
Remove the guesswork from your current strategy by going directly to the source. Get started with a free trial!
Share this post