Webinar: Challenging the Traditional Concept of DIY Consumer Insights

DIY market research isn’t what it used to be. 

When you think of the traditional DIY methods of gathering consumer insights, chances are you think of a time-consuming process that requires expertise and a lot of effort.  But, as organizations strive to do more with less, intelligent and automated solutions are taking the burden off of the “Y” in DIY. 

Find out how the next generation of consumer insights platforms are empowering organizations of all sizes to start, perfect, and scale their research operations, increasing their impact on both consumers and the marketplace. 

In this webinar, we...

  • Delve into the history of DIY market research methods. 
  • Explore the benefits of new DIY research technology. 
  • Demonstrate how the most iconic and innovative companies are leveraging end-to-end DIY platforms to gain a competitive advantage and de-fragment their research process. 


This webinar was a part of the Greenbook Insights Tech Showcase.

If you're interested in learning more see our Reinventing Consumer Insights with A.I. Driven Analytics & Curiosity Webinar, or request a demo to find out how DIY market research software can help you do more, with less. 


Estimated Read Time
1 min read

The Guide to Brand Health Tracking

Anytime you feel physically or mentally unwell you seek out the expertise of a trusted practitioner. But what happens when your brand's vitals start to flatline? 

Maybe your sales have taken a dip, or perhaps your social engagement has stagnated. While it’s easy to blame a combination of outside factors, from current events to natural ebbs and flows, wouldn’t it be nice to know for sure? 

That’s where brand health tracking comes into play. 


What is Brand Health Tracking?

Brand health tracking gathers and analyzes consumer data to give you a 10,00ft view of your brand's performance. Think of it as your way to measure the ROI of your branding efforts. 

You can use brand tracking to benchmark key indicators like brand awareness, perception, loyalty, and more to understand how consumers interact with your products, their overall sentiments towards your company, and your brand experience. 


Benefits of Brand Health Tracking


Type=Default, Size=sm, Color=SuccessDiscover ways to Drive Revenue

Find out how KPIs like brand awareness, perception, loyalty, and preference impact sales and what you can do to increase revenue. 


Type=Default, Size=sm, Color=SuccessUnlock New Avenues of Growth

Gain perspective on your brand’s strengths and weaknesses as seen by the market to discover new growth opportunities and areas of improvement.


Type=Default, Size=sm, Color=SuccessAlign Your Messaging

Use key insights on brand perception, engagement, and purchase intent to identify your ideal customer and market to them effectively. 


When it comes down to it, your organization's most valuable asset is your brand. So, you can’t just leave its health up to chance. A consumer's perception of your brand can be the difference between instant trust and skepticism or strong engagement and disinterest. If your brand is unhealthy, it could actively damage your organization. 

Even if your sales are trending upward and you’ve effectively captured your audience, tracking brand health allows you to see what truly matters to your audience from a 10,000ft view. This gives you space to clearly identify strengths, weaknesses, and opportunities. And in uncertain or volatile times, tracking your brand's health gives you the power of agility, allowing you to gauge the market and adjust when needed.


Brand Tracking Methods - Not Your Average Check-Up

There are a few ways to gather insights into your brand, but today we are going to center our methodology on collecting data through consumer surveys and existing customer feedback.

This approach allows you to hear from a sample representative of your target audience, and directly see how specific consumer segments react to your brand. Not only can this provide you with quantitative data, but through open-ended survey questions you can utilize Natural Language Processing (NLP) to reveal common themes and sentiments. 


Brand Tracking Metrics

When it comes to brand tracking there are a wide array of metrics you can measure, some of the most popular include: 


Brand Awareness

A consumer's ability to recognize your brand. Questions could include: “Which of the following brands have you heard of?” or “How did you hear about [BRAND]?”


Brand Purchase

This identifies previous and existing customers. Questions might include: “Have you purchased a [BRAND] product?” or “How did you purchase [PRODUCT] from [BRAND]?” 


Brand Usage

This metric determines how often a customer has purchased and used your product. Questions could include: “How often do you use [BRAND]?” or  “Which of these brands do you use regularly?”


Brand Perception

A consumer's overall perception of a brand, including its quality, performance, customer support, aesthetic, etc. For these types of questions, we generally use a Likert scale to see how much consumers agree with statements like: “This brand is relevant to me” or “This brand has earned a strong reputation.” 


Brand Preference

The degree to which a consumer will choose your brand over the competitors. Similarly, we can utilize a Likert scale to assess how much consumers agree with statements like: “[BRAND] stands out from its competitors” or “I am strongly committed to [BRAND].”


Brand Loyalty

The likelihood of customers continuing to purchase your products and engage with your brand. Yet again, we use a Likert scale to find out how much consumers agree with statements like: “I am likely to purchase from [BRAND] again” or “I plan to buy from [BRAND] again in the future.” 


Net Promoter Score

The probability that a customer will recommend your product or brand. This question is simply: “On a scale of 1-10, how likely are you to recommend [BRAND] to your friends and family?”


Run the Numbers

Once the data has been collected from your study, it’s time to analyze the results. 

How did your target audience respond to your survey? Did they have positive or negative things to say about your brand or products? Do you have a high or low NPS? Keep an eye out for criticisms or compliments that are repeated often- these can give you crucial insight as well. 

From here, you can dig even deeper to understand how different consumer segments react to your brand and what they find important. Similarly, filter the data by variables that matter to you to compare and contrast how different audiences feel about your brand and messaging.


Keep Checking the Pulse 

After you’ve completed your first brand health tracking study it becomes simpler to replicate the process to keep a pulse on your market. It’s important to measure the feelings of your target audience often over time to see how your product launches, advertisements, events, or messaging can change public perceptions. 

Many different factors may affect how often you should run your brand tracking research. If, for example, you simply want to monitor the impacts of your brand-building efforts, quarterly tracking is a common choice. Conversely, monthly tracking may be best if you’re measuring the influence of a new marketing campaign. When current events create uncertainty or volatility in the market (like COVID-19), it can be helpful to track your brand's health on a weekly or monthly basis. This level of frequency gives you data in real-time, allowing you to optimize as you go. 


Brand Tracking with SightX

If you’re ready to measure, track and benchmark your brand performance we’ve got the tools to make it simple. 

The SightX platform is the next generation of market research tools: a single unified solution for consumer engagement, understanding, advanced analysis, and reporting.

But, SightX isn’t just great tech. Our Research Services team knows all of the best practices, along with some pro tips and tricks for getting the best data out of your surveys and experiments.

Reach out to our team to get started today!


Estimated Read Time
5 min read

What is Concept Testing & What are the Steps to Running One?

It’s a well-known fact that around 95% of all new ideas fail.

From Colgate’s foray into frozen kitchen entrees in the 1980s to Heinz’s memorable “EZ Squirt'' colored ketchup, not even the largest brands are immune to spectacular failures. But it’s not just products; new advertisements, branding, logos, and messaging can all similarly fall victim.

So why is the rate of failure so high? And what can you do to mitigate your risks? Often, the answer is simple: know your audience

While there are a variety of reasons why an idea may not succeed, poor decision making and lack of market orientation can be large drivers. Both of which stem from a brand not quite understanding what their audience loves, and what they could do without. This is precisely where concept testing comes into play. 


What is Concept Testing? 

At its core, concept testing is the process of evaluating an idea to better understand how it will be received by consumers before it hits the market.

Concept tests allow you to ask consumers how they feel about your new idea, providing you with direct feedback on its viability. Not only does the information from concept testing help you avoid costly mistakes, but the insights gleaned can also help you further develop your idea and go-to-market strategy. 

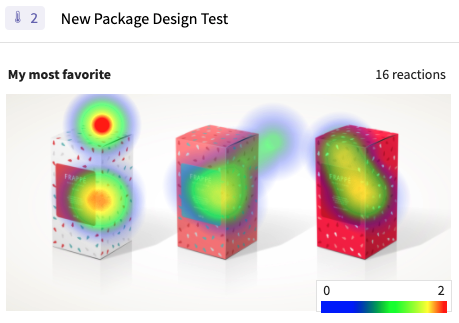
While there are various concept testing methods, we will primarily focus on survey tools. If you’re interested in learning about other techniques, find out how to get creative with heatmaps.


Why is Concept Testing Important and What are the Benefits? 

Concept testing plays a major role in the trajectory of a new idea, providing insights and eliminating the risks associated with sub-par market research. While your team might think their latest idea is genius, the opinions of your target audience are the only opinions that truly matter.

If they don’t see the value in your idea during testing, they definitely won’t see the value once it’s released. 

Here are some benefits of concept testing: 

Type=Default, Size=sm, Color=SuccessBetter understand consumers likes or dislikes to adjust your concepts accordingly. You can repeat this process until you hone in on the best possible version of your idea. 

Type=Default, Size=sm, Color=SuccessEliminate the time you would have wasted chasing the production of a poor concept. 

Type=Default, Size=sm, Color=Success
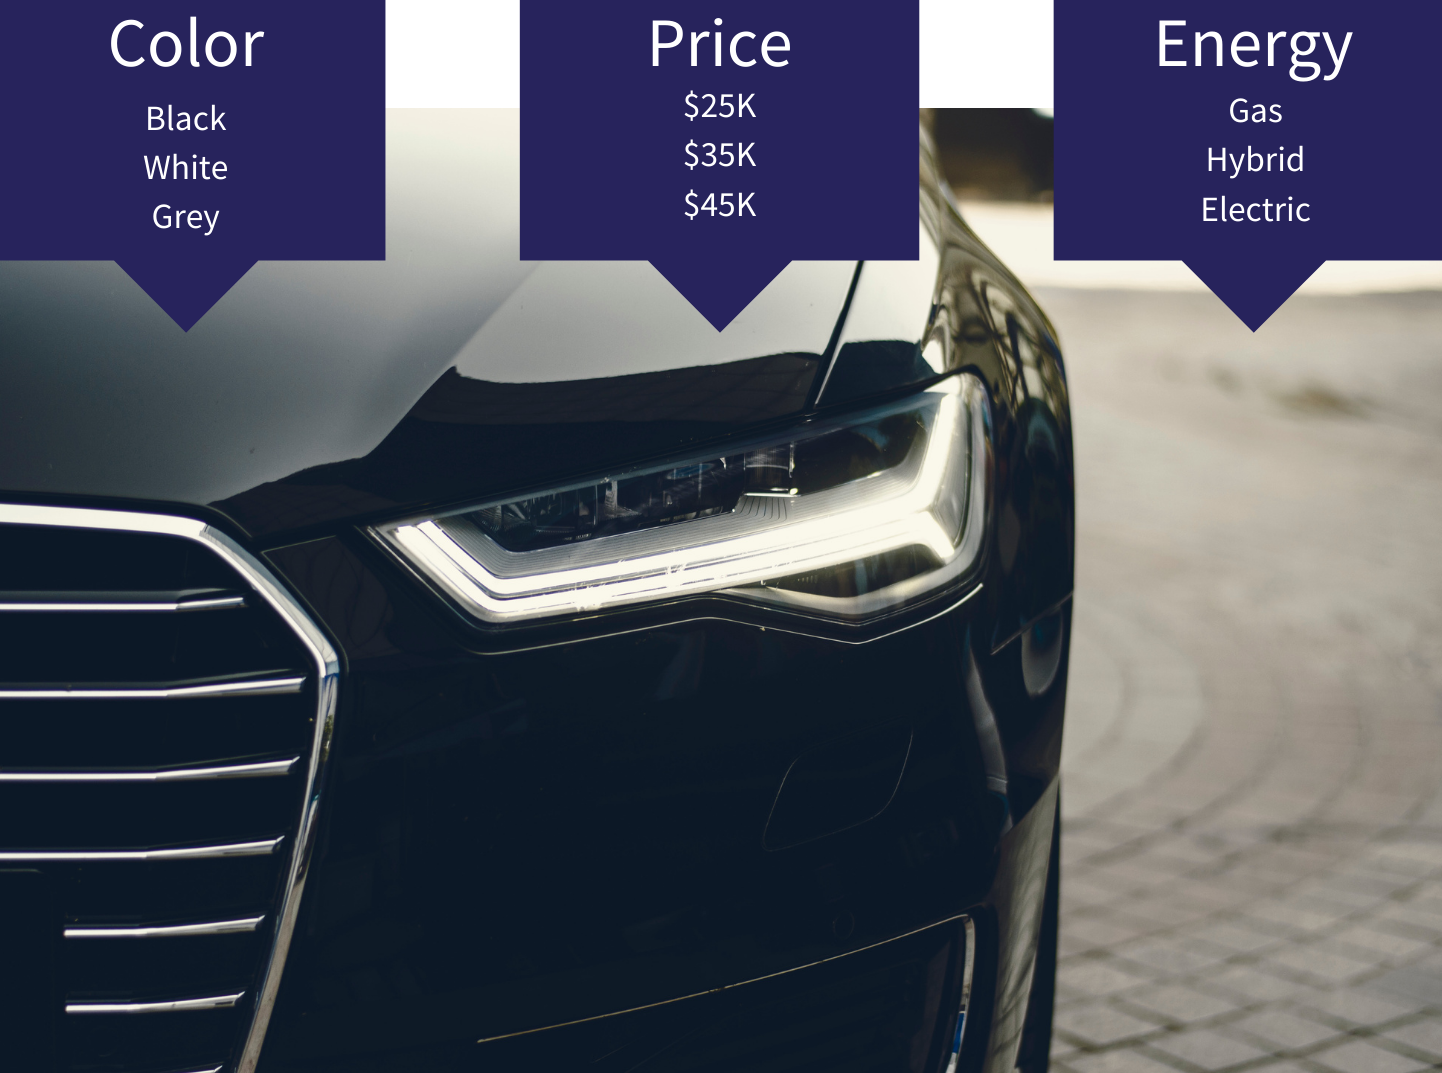
Because most concept tests can be done via online survey platforms there is a high degree of flexibility. This means you can easily gather feedback on many facets of your idea, from pricing to style, allowing you to perfect every last detail before release.


Types of Concept Testing

Comparison Testing

Comparison testing is exactly what you'd expect. Respondents are shown two or more concepts and compare them by simply selecting their favorite or using ranking or rating-scales questions. 

The results of a comparison test are often clear and simple to understand. Which makes it easy to determine which of your concepts is the winner. 

But comparison tests aren't without drawbacks. One major issue is a lack of context. Comparison testing gives you little insight into why one concept was selected over the others. 


Monadic Testing

With monadic testing, your sample (pool of respondents) is separated into groups. Each group sees only one concept, meaning there is no comparison, simply an in-depth evaluation of the concept shown. 

Because respondents are only shown a single concept, this method makes it possible to get in-depth insights without the drawbacks of a lengthy survey. So instead of simply understanding which concept won, you can better understand how consumers feel about the elements of each. 

But, once again, there are some drawbacks. To break respondents into groups you'll need a larger sample size, which can drive up your cost and time-to-insights. 


Sequential Monadic Testing

Much like monadic testing, sequential monadic testing also requires you to split your audience into groups. But instead of only showing one concept to each group, respondents evaluate all of your concepts in random order. Each group is asked the same follow-up questions at the end of the rotation. 

As each group evaluates all of the concepts, the required sample size for a sequential monadic test is smaller- reducing costs. It also allows you to test multiple concepts in a single round, making it quite efficient. 

But, as you guessed it, this methodology isn't foolproof. Because respondents see all of your concepts, the survey length can be long. This ultimately affects the completion rate and can even cause respondent fatigue- which leads to poor data quality.


Proto-monadic Testing

As the name might suggest, proto-monadic testing is a combination of sequential monadic and comparison testing. This method has respondents examine multiple concepts and then choose the one they prefer. 

Ultimately proto-monadic testing allows you to confirm that the winner of your comparison test is compatible with the in-depth insights gained on individual concepts. 


When Should I Run a Concept Test? 

Ideally, you should run a concept test for any major new idea or change to your products, pricing, services, or messaging. All kinds of challenges can be solved or averted entirely with the right kinds of research.

Generally, businesses use concept testing to compare new products, pricing, or brand messaging. However, the benefits of concept testing are not unique to these circumstances. Here are a few other scenarios where a concept test could be helpful:


 Type=Default, Size=sm, Color=Success Further Develop Ideas 

So you like your idea, but what about your target audience? By running a simple concept test, you can utilize valuable consumer insights to tweak and perfect your idea, ultimately upping the likelihood of breakout success.


Type=Default, Size=sm, Color=Success

 Eliminate Poor Ideas

While it may seem like a given, you can learn quite a bit from eliminating low-potential ideas. Often you can learn why these ideas fell flat with your audience so that you can avoid making similar mistakes in the future.


Type=Default, Size=sm, Color=SuccessIdentify High-Potential Consumer Segments

Who is most enthusiastic about your idea, and why? By finding out which consumer segments are likely to purchase your product, and their reasons for doing so, you can more easily identify the ideal market(s) for your idea. 


Type=Default, Size=sm, Color=SuccessPerfect the Marketing Strategy

Once you’ve identified your high-potential consumer segments, you can also learn what makes your idea valuable to them, whether it be specific features or pricing. With that knowledge, you can remove the guesswork from your marketing and meet your audience on their terms.


How to Run a Concept Test 

Running your concept test doesn’t have to be difficult, but it is important to follow a few best practices:

Gather Stakeholders

To kick off the process, meet with the relevant stakeholders to brainstorm all of the concepts you would like to test. This meeting is also a great opportunity to set the parameters for your test, such as the number of concepts, sample size, budget, and survey methodology.


Set Specific Goals

Define clear objectives and goals. Think about the purpose of this test and the specific details you’d like to gather from participants. What kind of data would be most helpful for your decision-making process? How are you planning to analyze the data once collected? What kind of response do you want to get? Setting these intentions early on provides a point of reference for all of the stages yet to come.


Choose the Right Methodology

While your sample and the items being tested are often top of mind, the design itself is equally crucial to success. Two of the most popular survey methodologies are monadic testing and sequential monadic testing.

In a monadic test, your target audience is split into multiple groups. Each of these groups is then shown one of the concepts and asked for their opinions on specific features they like or dislike. Because only a single concept is shown per group, you can ask more follow up questions to get in-depth insights without compromising the survey's length. Because the audience is broken down into smaller groups, you will often need a larger sample size, which can raise your cost. However, if you only have a few concepts to test or are not on a tight timeframe, monadic testing might be best for you.

Conversely, sequential monadic testing shows respondents two or more concepts presented in a random order to avoid bias. Each concept is followed by the same correlating questions to gather data. While this type of testing often demands a longer survey length, the sample sizes can be smaller and you can often glean consumer insights from the respondents’ comparisons of each concept. If you have many concepts, limited metrics, or a smaller budget; sequential monadic testing might be right for you.


Build the Survey

At the outset of your survey, make sure to provide participants with some context about what they can expect from the experience. Next, include high-resolution visuals (images or videos) and clear text that describe your concept.

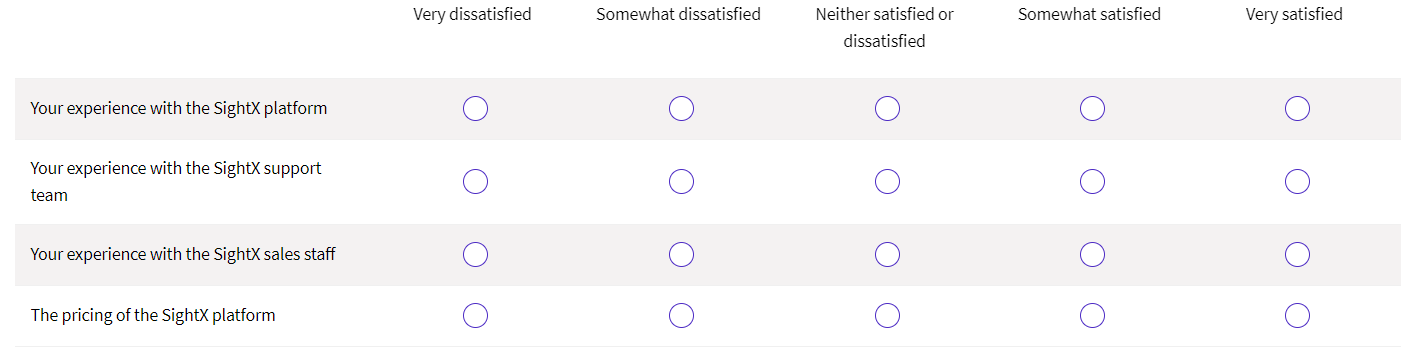
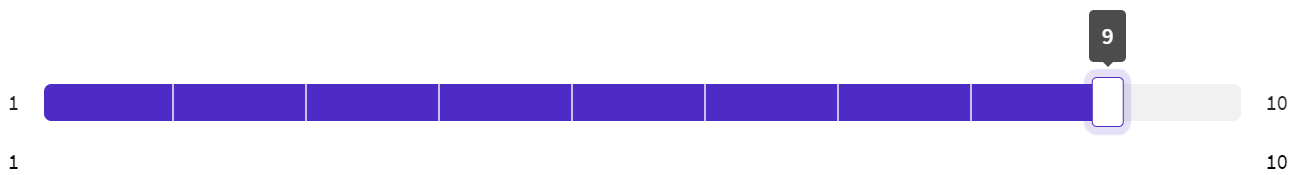
Always present these in a consistent manner to avoid any potential bias. For the questions themselves, refer back to your visuals and text often to remind respondents which concepts you are referencing in each question. Additionally, consider using Likert scales to allow respondents to rank their opinions. Not only does this help to create a consistent structure, but the type of data collected enables automated analysis.


Field the Survey

Depending on the types of concepts you are testing and your available budget, the audience you target may vary. If you’re a smaller company with a low budget simply looking for some initial reactions to your idea, consider fielding your survey to trusted co-workers, connections, and friends. This can be a great (free) way to gather feedback and further develop your idea.

If you are looking to add new features to an existing concept, introduce a new pricing model, or change your branding, field your survey to loyal customers first. While you may still want to send your survey out to a larger population later on, the insights gleaned from your loyal supporters can be extremely valuable.

If you are developing an entirely new concept you will most likely want to choose a sample representative from a survey panel provider. To get the most relevant data, the sample should be representative of your target audience, which will then inform the ideal sample size. For example, if you are interested in learning about a concept’s appeal across the United States, the sample size will need to be large enough to account for the populations across each state. In this scenario, a sample size in the thousands would be most appropriate. Conversely, if you’re interested in learning about the appeal of a concept among millennial females living in Austin, Texas, your sample size can be as small as 200 respondents. 
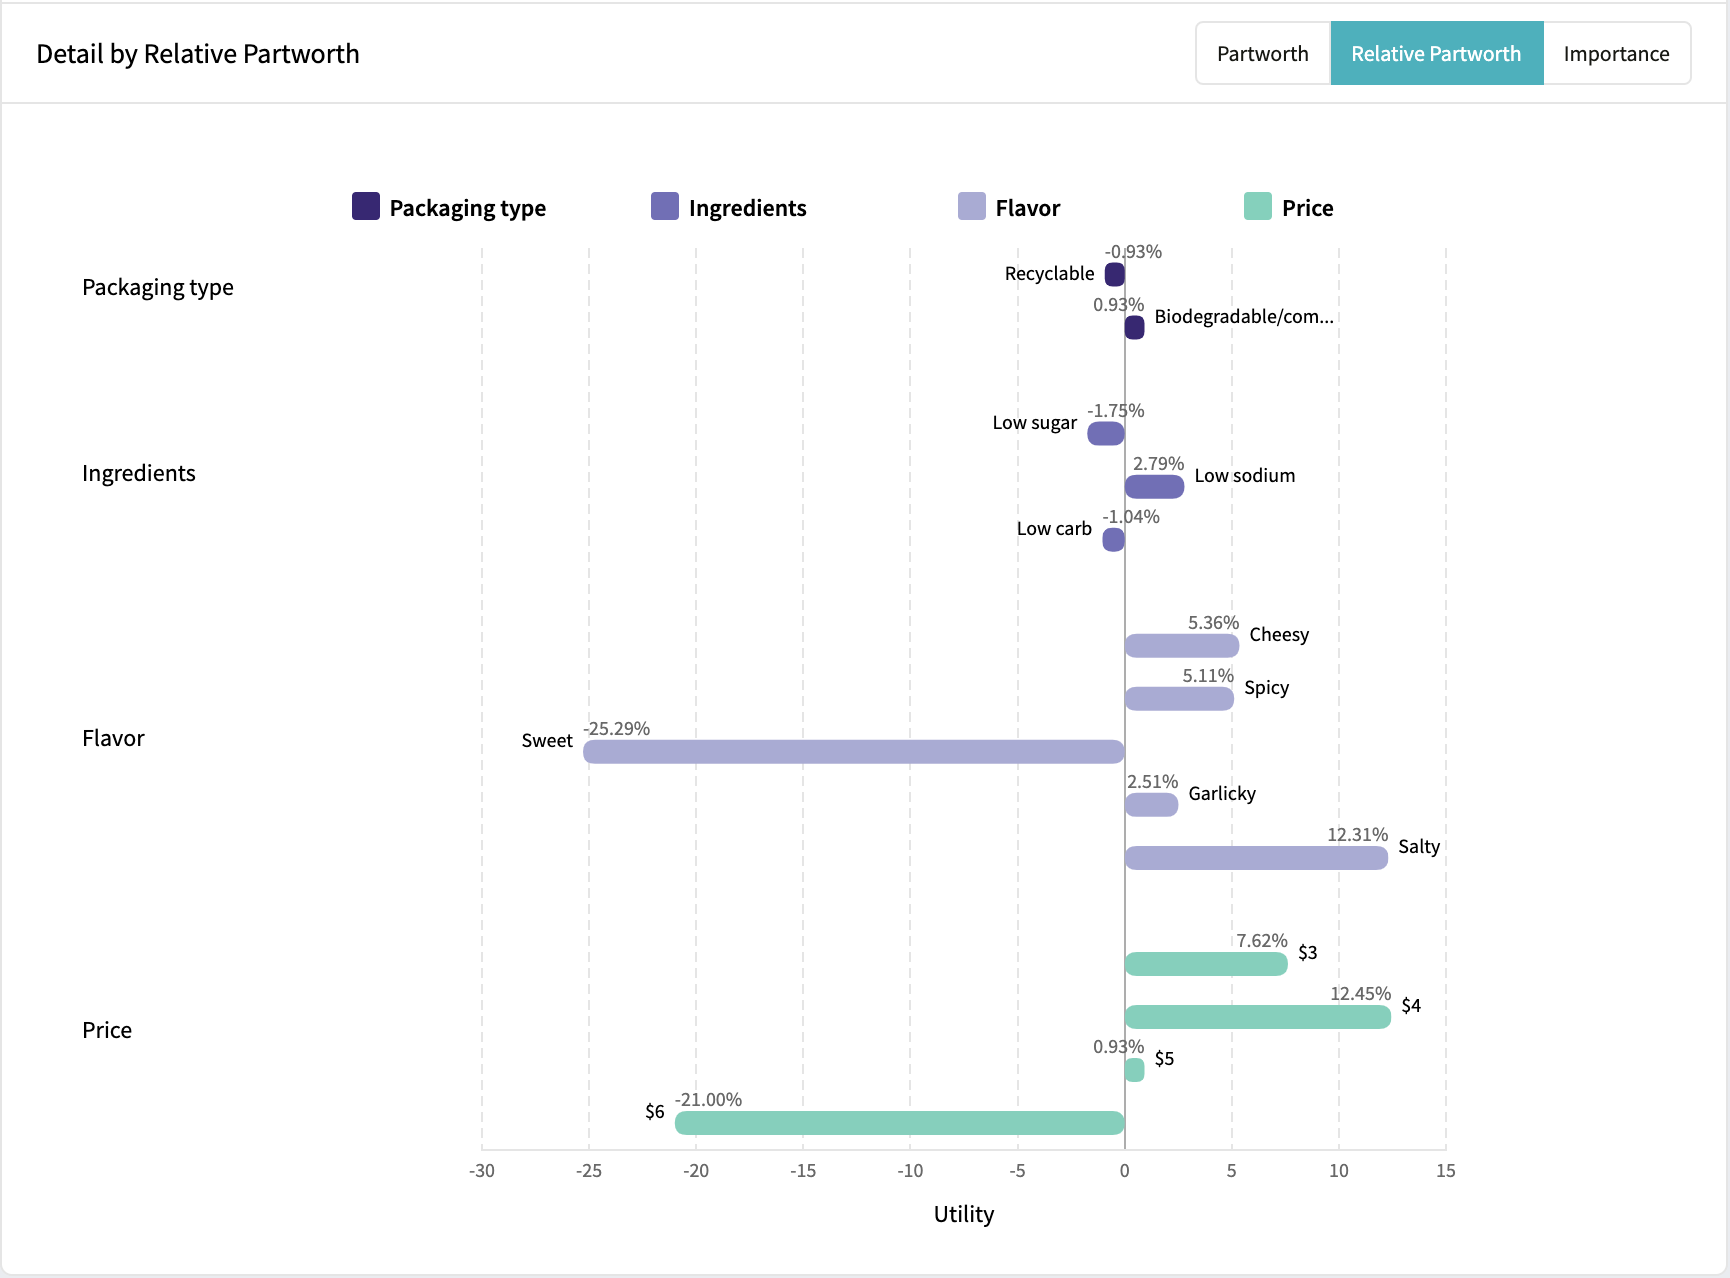

Analyze the Data

Once you’ve collected all of your responses, it’s time to turn them into insights! The first step is simply ranking the overall performance of each concept. Which performed best overall? What concept was a flop? From there, think of different market segments or groups that are important to your organization. Was their preferred concept different from the overall winner?

From there, you can drill down even deeper to compare the data and filter for variables that are important to you. These can be as simple as demographic variables, like age, gender, or ethnicity. Or, you can filter for "control" variables, like those who eat healthy v.s. those who don't.

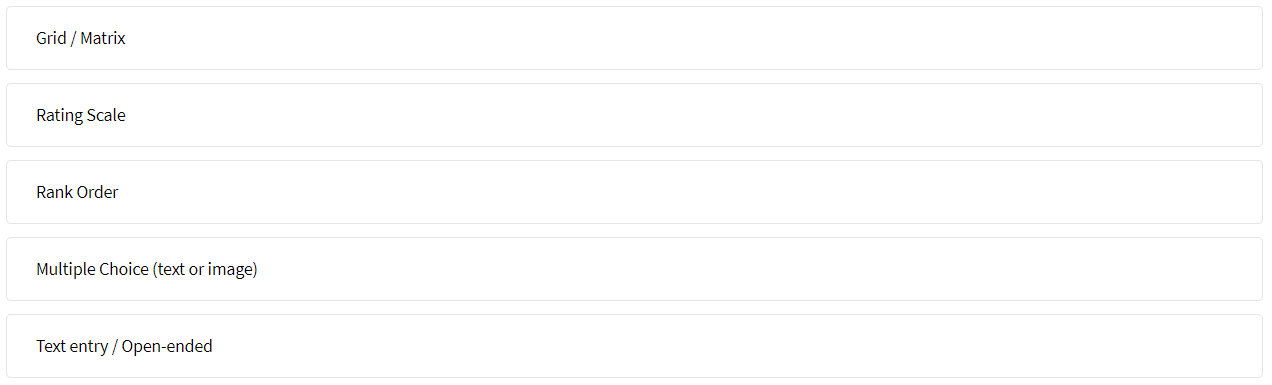
As a general tip, think about each of the multiple-choice questions in your survey. Often you can rely on these to filter, compare, and contrast different audiences- allowing you to build personas based on them.


Concept Testing Examples

Concept testing is used by a wide range of companies across many different industries. Some of the most popular examples of concept testing in the real world include: 

Bonterra Organic Estates- New Product Concept Test

When our client Bonterra Organic Estates was ready to expand its portfolio with a new ultra-premium tier of wines, their branding team was tasked with creating an entirely new portfolio design. 

They turned to SightX's concept testing software to compare the new packaging options and dig deeper into the perceptions surrounding each. They also added heat maps to their concept test, allowing them to get detailed feedback on individual elements of each design. 

These insights allowed Bonterra's brand team to select and perfect a final concept, launching their new tier with confidence. 


Feltman's - Packaging Concept Test

You might recognize our client Feltman's of Coney Island for being the world's first hotdog. But, as their core products grew to gain national recognition, the team set their sights on expansion with plans to release a new bacon product. 

Not only would they need to understand how potential customers would consider their new bacon offering, but they simultaneously needed to test different packaging, sizes, and price points. 

Using SightX's concept testing features, the Feltman's team was able to gather business-critical insights in less than a day. These insights not only helped them select a winning packaging design but also allowed them to find the ideal packaging size and price for their target market. 


Grounded.World- Competitive Concept Testing

When our client Grounded partnered with B Water & Beverages Inc. (who had licensed Brita®) they were tasked with developing the concept for a new bottled water in infinitely recyclable aluminum packaging. 

This new product was not only meant to be an eco-friendly alternative to single-use plastic bottles, but it also needed to compete in a crowded premium bottled-water market. 

They turned to SightX's concept testing software to test out bottle designs, compare their winning design against competitors in the space, and test messaging for marketing purposes. 

The insights from their study led to a packaging design with high appeal and purchase intent that stood out in a crowd. So much so that even though the product hadn't yet been launched, the winning design had the highest purchase intent score across the entire category. 

Once the product was launched, they saw major press pickups in outlets like Forbes and a wave of rave customer reviews. But it wasn't just the media and consumers who loved the new product. Retailers also took note, helping Brita sell their newest product into major chains on their very first meeting. 


Concept Testing with SightX

The SightX platform is the only tool you'll ever need for concept testing: a single, unified solution for consumer engagement, data collection, advanced analysis, and reporting. While powerful enough for insights teams at Fortune 500 companies, the user-friendly interface makes it simple for anyone to start, optimize, and scale their research. 

Plus, with SightX's research team, you can gain access to the best thinking in the insights field. Our in-house experts will guide you through every step in the market research process, from survey scripting to analysis support, and everything in-between. 

If you're ready to get started with iterative market research, get started today!


Estimated Read Time
11 min read

Five Ways to Get Creative with Heatmaps

We’ve said it before- and we'll most likely say it again: consumers are changing.

It should come as no surprise that consumer behavior has evolved quite a bit in recent years, but that evolution was fast-tracked in 2020. From where they shop to how they want to connect with their favorite brands- consumers demand engagement on their terms.

Effective engagement can mean speed and efficiency, but more often than not, it also demands creativity.

For insights teams, in particular, this can be a challenge. However, a modern, effective, and creative way to get impactful feedback from consumers is through a heatmap experiment.

A heatmap is a visual storytelling exercise. It organizes data about an image using color-coded zones representing the frequency of activities, interactions, or sentiments.

Historically, heatmaps have been a popular visualization tool with data-driven researchers across industries. Given current consumer trends, it shouldn’t come as a surprise that heatmaps have been gaining popularity in recent years amongst leading researchers. While they remain a key tool in user interface and experience research, their usage in concept and product testing research continues to gain popularity.

To help spark some creativity and curiosity, we’ve put together a list of simple ways you can incorporate heatmap techniques in your own research:


Whitespace & Prototype Testing

Exploring white space and researching prototypes are important initial steps in the product innovation process. If you have some initial ideas or mock-ups for a product, heatmaps can be an important early indicator about which attributes your potential customers would be compelled by, or (just as importantly) be repelled by.

Efficient and effective prototype feedback allows you to refine your products earlier in the development process- before you even begin building your minimum viable product (MVP).


Design Testing

Getting feedback on visual design elements like fonts, colors, layouts, and imagery is an important step in the research process, and heatmap experiments are one of the most cost- and time-efficient ways to do it.

Using heatmaps for design testing allows you to identify what works and what doesn’t for any customer-facing visuals.


Package Testing

Most products go through many iterations of packaging designs before launch. Testing various concepts with heat mapping allows you to gain detailed insights into potential customers' preferences surrounding specific packaging attributes.

Respondents have the opportunity to select and react to design elements, logo placements, packaging types, and other details - allowing you to understand where consumers focus their attention and in what order.


Ad & Message Testing

Your go-to-market messaging and content strategy can make or break your product launch. However, message testing isn’t just about the words themselves - the taglines, logos, and other copy in the ad are just as important as the package and product designs.

Using heatmaps, you can test which ad or message garners the most positive or frequent interaction, and which drives more viewers to engage with the Call-to-Action. Consumers indicate to researchers where the messaging is catching their attention, if that attention is positive or negative, and why they feel that way.


Shelf Placement

Even though most of us are primarily shopping online, the in-store experience cannot be overlooked. Pandemics aside, consumers will continue walking into stores for the foreseeable future. By testing how a consumer responds to different shopping environments, you can understand how to maximize value both for the customer and your brand during in-store shopping experiences.

Of course, the shelf is a critical point in the in-store customer journey. Heatmaps are a great way to understand optimal shelf placement and product combinations that will entice consumers to reach for your products. They can also help with the design of the shelf itself!


These are just five primary examples of how heatmaps can enhance your consumer research to provide visual, data-driven insights. They are a quick, fun way for consumers to provide insights in a survey setting, and make a great addition to any research report.

Start exploring heatmaps with a free trial!

Estimated Read Time
3 min read

What is Conjoint Analysis? Answering the Most Common & Compelling Questions

If you work in or around market research, you have most likely used or (at the very least) heard of conjoint techniques.  

We will be the first to admit that literature on the topic is often intensive and can feel overwhelming for those unfamiliar with the ins and outs of conjoint analysis.

But, this doesn’t have to be the case.

While the SightX platform can automate your curiosity and research projects, it's still crucial to understand the methodologies you use. 

To save you from sinking into a technical white paper, we’ve compiled some of the most common questions we get about conjoint analysis.


What is Conjoint Analysis? 

The concept itself is quite simple. 

Conjoint analysis is a market research approach that measures the value consumers place on the features of a product or service. It does this by uncovering the rules consumers explicitly (and implicitly) use to make their purchasing decisions by mimicking the real-world trade-offs made when shopping. 


History of Conjoint Analysis 

Now for some backstory. 

You can trace conjoint analysis back to the 1960s, having been created by mathematical psychologists and statisticians Luce and Tukey (1964). The two published an article exploring how measuring the goodness of specific characteristics of an object could enable one to measure the goodness of an object as a whole. 

Professor Paul Green would later realize the marketing implications of this work; believing it could help marketers understand how buyers make complex purchasing decisions and ultimately predict shopper behavior. 

This would eventually lead to Green coauthoring a historic article with Vithala Rao which detailed the first consumer-oriented approach for the methodology. 

Throughout the decades since, conjoint analysis has evolved and become increasingly popular within the marketing research industry. 


What is the Purpose of a Conjoint Analysis?

Conjoint analysis has many purposes, but it is most commonly used to uncover consumer preferences about your product to predict adoption, gauge price sensitivity, choose the optimal set of features, and project market share. 

The most popular use for conjoint analysis is generally within product development, helping brands find the perfect set of product features and messaging points for their target market. 

Conjoint analysis is an incredibly versatile methodology and can be used across most industries for products ranging from vacation travel packages to consumer packaged goods. 


When Should I Consider Conducting a Conjoint Analysis

When it comes to making a purchase, consumers often consider a variety of product features

 These features can be referred to as product "attributes", with each "attribute" having several levels or options.

To illustrate, let’s use an example: A major automobile manufacturer is considering adding a new car to its lineup. While they have some ideas for the new vehicle, they want to know what consumer would be most willing to purchase. So, they decided to run a conjoint analysis to explore three attributes. 

The first attribute is car's color, making the choices of color the attribute levels (black, white, or grey). Another attribute is the car's price ($25K, $35K, $45K). And the third attribute is the energy type the car uses (gas, hybrid, or electric).


Sample of conjoint analysis data. Image of a car with "color", "price", and "Energy" overlaid with their corresponding levels

A conjoint analysis will show the company which attributes matter most to consumers, the levels that are most popular, and what the optimal combination to maximize sales. 


Steps to Doing a Conjoint Analysis

Running your conjoint analysis is much easier than you'd think! Just follow these simple steps: 


Identify The Attributes

The first step is to gather the product attributes you want to test. In this case, "attributes" refer to the features of the product. 

While it can be easy to get yourself wrapped up in the minutia of your product, keep in mind that less is more here. 

Adding too many attributes to your conjoint experiment will only make it more difficult for respondents to accurately assess your product features. Generally, we would suggest you keep your number of attributes near 3. 


Set Your Levels

While "attributes" are the features themselves, "levels" are the options related to each attribute you're testing. 

Similar to the attributes, adding too many levels to your experiment will create a heavy cognitive load for respondents and may even overwhelm them. So again, less is more here. We would generally suggest no more than 4 levels per attribute. 


Input Your Information into SightX

While there are certainly manual methods of creating a conjoint analysis, automation can be a HUGE timesaver. 

After you have gathered your attributes and levels, you can easily create a conjoint experiment within the SightX platform by selecting "Conjoint" from the methodologies menu. 

You can include a description with instructions for respondents, giving them a brief background on the category or types of products they will be evaluating. You can also add images to make the process more engaging. 

With the details you input, the SightX platform will generate a balanced experiment. 


Choose a Sample Size and Launch Your Experiment

Once the experiment is ready for launch, it's time to consider your sample. It's important to include a sufficient number of respondents in your conjoint experiments, you can use our handy Conjoint Sample Size Calculator to determine the right sample size for your project.

Once you know the sample size required for your conjoint analysis, you can launch your project to begin gathering data. 

As for the analysis, we'll cover that below: 


Outputs of Conjoint Analysis

Once you've collected data, your conjoint analysis graph will look something like this: 

Screenshot 2023-05-11 at 9-56-55 AM-png


The graph above will not only show you the importance of each attribute but also the popularity of each level within the attributes. Ultimately this data will help you better understand the optimal package of features for your product. 

SightX provides three types of conjoint data analysis: Part-Worth, Relative Part-Worth, and Importance. You can toggle between the three on your graph. 


What is Part-Worth and How Does it Relate to Conjoint Analysis? 

While several estimation models are listed above, the most widely used is the Part-Worth model. 

Unlike the other models, it does not make any prior assumptions regarding the utility caused by a specific level of any attribution. Simply put, the outcomes will be a more accurate depiction of consumer preference.

In your product research, you will see that multiple attributes come together to define the total worth of a product. And some may be more important to consumers than others.

Part-worth is the estimate of the overall value (or utility) associated with each attribute and level used to define your product. So, the values of each separate attribute are the part-worths.

There are several research techniques to estimate part-worth. The most widely used are Latent Class Analysis and Regression modeling based on Hierarchical Bayesian (HB).

The values of the part-worth utilities provide information on how attractive attribute levels are. Remember the example of car types across various price points and colors?

If you want to know the relative importance of each attribute, you will need to calculate Attribute Importance by determining how much difference each attribute can make in the total utility of a specific product. That difference is the range in the attribute's utility value.

You can calculate percentages from relative ranges, obtaining a set of attribute importance values that add up to 100. The higher the percentage is, the more important the feature.

In the end, you can discern which features should be combined for the most impact- ideally, you are working with a software platform that automates this process for you.


What is the Link Between Conjoint Utility Scores and Market Share?

In addition to those insights, you may be interested in taking your utility scores and using them to simulate market share, where a market simulation provides information on the relative share of respondents who prefer predefined products in a certain context.

Simulating market share enables researchers to test various scenarios and assess factors like price demand curves, the impact of product adjustments, and the competitive landscape.

The first step in conducting a market simulation begins with specifying relevant products. The total utility of these products is computed at the individual or target level- the total product utility being the sum of its part-worth utilities (Green and Krieger, 1988). From there, consumer insights leaders can compare the total utility value of products to that of a “none of the above” option.

The larger the difference between the total utility score of an alternative and the utility score of the “none of the above” option, the more likely it is for users to accept the alternative. Conversely, if a product's total utility score is below the “none of the above” option, it indicates that the users are not likely to accept the offering.

Researchers can apply the logit model to estimate market share. Market share is predicted by simply exponentiating the total utility and then dividing this value by the sum of all products’ exponentiated values and that “none of the above” option. Here is the formula:

conjoint-3

If, like most people, you’re a bit scared off by formulas, have no fear!

Conjoint analysis is simply the mathematical representation of what we covered in the paragraph above: “Market share is calculated by exponentiating the total utility of a product and then dividing this value by the sum of all products’ exponentiated values and the “none of the above” option."

The calculation can be done using a basic calculator equipped with an “EXP” (or ex) button.

Below is an example with total utility scores, exponential scores, and the market shares associated with it.

conjoint-4

While the overview above should prove helpful, we understand that these concepts can be technically challenging.

 SightX allows you to automate conjoint analysis, helping you to more easily optimize your product development and forecast the likelihood of market acceptance. Our step-by-step setup enables you to launch projects within minutes and instantly analyze results with real-time analytics.


Companies Using Conjoint Analysis 

Conjoint analysis is an incredibly popular tool for organizations of all shapes and sizes. Some recognizable names include: 

Type=Default, Size=sm, Color=SuccessNBC Universal Parks & Resorts have used conjoint analysis when designing their theme park experiences. 
Type=Default, Size=sm, Color=SuccessProctor & Gamble have relied on conjoint analysis for insights on messaging, pricing, and design for their CPG products. 
Type=Default, Size=sm, Color=SuccessApple used conjoint analysis to estimate the economic cost of patent infringements by their competitor Samsung. 
Type=Default, Size=sm, Color=SuccessBose has used conjoint analysis in their product development cycle and when extending their product lines. 


Estimated Read Time
7 min read

The Battle Between Machine Learning vs. Statistics Over Consumer Insights

With consumers providing so many data points through any number of information gathering techniques, it is imperative that companies take a strategic approach to analysis, especially that demographics no longer suffice. 

 Furthermore, effective consumer research should get at the “why” behind consumer behaviors and preferences to survive a competitive environment and lead the future.

All of this begs the question, how?  Researchers have been often debating the effectiveness of two techniques: machine learning versus classic statistics. The relationship between them has not been without its hardships, with each one of them making the case that it is the proper strategy for maximizing your ROI from the data collected from consumers.

Over a series of blog posts, we will help dispel some myths about a lot of buzzwords in the field. The first topic we’re tackling is, Machine Learning vs. Statistics. What is machine learning? What is classical statistics? Are they different? If yes, How? When do I use them? And which one is more effective to help me understand my consumers?


Machine Learning vs. Statistics

First things first, let us cover some working definitions for both. Machine learning and statistics are fields that employ various analysis techniques for the purpose of understanding data. Machine learning is a type of artificial intelligence (A.I.) that allows software applications to learn and predict outcomes without being explicitly programmed. You would mainly use machine learning to generate a prediction about your whole customer base from existing datasets.

Statistics on the other hand is defined as a branch of mathematics dealing with the collection, classification, analysis, and interpretation of data. It is powerful for drawing inferences about your customers from a sample of a larger population. While Machine Learning is concerned with identifying patterns based on existing datasets, the primary goal with classic statistics is to focus on both describing the data by reducing it to its most meaningful level and to infer about the larger population from only a portion of your customers.

Because of these reasons, they tend to focus on solving slightly different business needs. Machine learning rules when there is a need for an individualized prediction about a certain consumer behavior or trend. Statistics wins the day when there is a need to understand a big strategic question such as “why”, “how”, and for “who”. For example, machine learning is deployed when you’re interested in generating a list of recommended items for consumers based on past behavior. Statistics is optimal when you want to test a hypothesis around why consumers are buying specific products, or why behaviors are trending a certain way.

What makes a certain technique more effective than the other? The answer is it depends on what you are hoping to achieve. While a deep academic analysis is beyond this blog, here are three key differentiators.


Assumptions, Assumptions, Assumptions

The bell curve. We all saw it by day 3 of Statistics 101 class. It takes many back to that unpleasant time of your introductory class in statistics where the lecturer talked about things that we’ve just as soon forgotten. Do you remember what a t-test is and the meaning of a p-value or what significant testing is?  At the heart of it all is the ability to infer something about the population from only a sample. So we make assumptions about things such as the independence of observations and the distribution of the population.

For example, in our case as it may apply to the group of customers who responded to last month’s satisfaction survey or the brand health tracker from last quarter. The soundness of those assumptions and the representation of this sample as it pertains to the larger population will greatly affect the extent to which your prediction models about the larger consumer base are actually accurate.

On the other hand, when you apply machine learning to your analysis it is free from any of those assumptions. The focus is on the existing dataset at hand, such as recent purchase behavior or brand perceptions, and the patterns it can reveal. No assumptions are made because machine learning users are not interested in inferring something about the population from the sample. The population of interest is actually the sample.  The idea is the more data you have, the more patterns will be revealed. Over time, with more data the predictive models will improve.


Data Quantity vs. Data Quality

The second big differentiator between machine learning and statistics is the importance of sampling techniques. Statistics is concerned with inferring something about all of your customers based off of data from a survey of only a sample of the entire customer base. This is why you may hear statisticians discussing how important proper sampling is to the final outcome (e.g. see literally anything about political polling).

Machine learning assumes that the samples are independent and identically distributed from the population and that they are already representative of that entire population. The result is that machine learning techniques end up being way more pragmatic and cheaper to conduct on scale.

Keep in mind, however, that what you gain in scalability you may lose in accuracy. Google’s epic failure to predict the number of flu cases based on Google search terms in 2013 is a classic example.  While the underlying machine learning algorithms were relatively sound, ignoring variables such as uncertainties and sampling techniques lead to spectacularly inaccurate estimates over time.


 Exploring vs. Confirming: Different Ways of Learning

Data analysis techniques are classified as either exploratory or confirmatory. As the labels imply, exploratory analysis seeks to identify interesting or useful patterns, whereas confirmatory analysis tests specific hypotheses in the dataset that can either be confirmed or refuted.

You’re either looking for new trends in consumer data that you aren’t aware of or checking to see if customers are engaging with your products the way that you intended.

Machine learning algorithms are mainly exploratory and attempt to generalize decision making. Again, due to the fact that machine learning folks are less concerned with hypothesis testing.

Statisticians focus primarily on hypothesis testing. Asking questions like, are females more likely to purchase organic food than men? Are millennials more conscious about environmentally friendly products than other generations?

Both have their place in solving business challenges, depending on the context. Companies need to take a step back to evaluate which method is the best for that particular problem before getting caught up in the buzzwords of the moment. Or feel free to just reach out to us!


So What?

Given the choice between machine learning and classic statistics, which should be used? Of course, the answer is it depends. It is becoming clear that both fields can benefit from each other and both fields can assist in better understanding consumers.

The team at SightX has extensive experience in data analytics and have helped companies of all sizes make data-driven, consumer focused decisions. We have a general excitement about the potential for big, meaningful impact that we can have in the world of consumer research.

We admit, “machine learning” has a sexy ring to it, but trendy buzzwords do not a smart business decision make. Blindly following trends won’t benefit anyone. Big data doesn’t mean smart data. We want to contribute intelligent tools to the consumer research space to help free time for thinking within companies.

Estimated Read Time
5 min read

Just Like Content, Context is King

Suppose you are asked to assess the impact of a brand's messaging, an educational program sponsored by the government, or perhaps even a leadership development course for corporate America.

If you are new to the world of market research or consumer insights, chances are you’re not quite sure where to begin, let alone the most effective methods of gathering the applicable data. 

While you can benefit from learning about the proper dimensions that have been identified by experts- be it impact assessment or leadership development- what is crucial is that you make them relevant to those you are trying to engage.

One of the best ways to do so is to create a research survey whose answers can help you ascertain the effectiveness of the messaging, program, or course you want to assess. However, it isn’t as simple as you may think. In order to generate effective audience insights that are highly relevant and actionable, we recommend a few best practices:

  • Conduct Several Preliminary Interviews: In the beginning, make sure to conduct multiple interviews with the stakeholders involved. They can shed light on the meaningful dimensions you will need to evaluate in your project, ultimately providing you with the proper context. 

  • Host Focus Groups: When possible, conducting focus groups can be another beneficial activity. These groups open the door for dynamic conversations that elicit a diversity of themes and ideas that would otherwise be difficult to obtain in one-on-one interviews. 

  • Synthesize: Your interviews and focus groups will likely result in rich transcripts and material to synthesize. From here, it should be easy to identify the critical issues, dimensions, actors, timelines, or events that will be relevant to your research survey. 

  • Generate the Survey: The next step is building a market research survey based on the materials you have gathered and synthesized. With this information, you can be sure you are developing appropriate and useful questions that provide you with the most relevant data. 

  • Ask for Feedback: One of the easiest ways to ensure your survey is successful is to request feedback. Circle back with the relevant stakeholders for initial thoughts, reactions, and comments.  

  • Pilot: Before sending out your survey en masse, it’s generally a good best practice to pilot it with a small group first. While simple, this step allows you to uncover a host of potential issues you may have otherwise missed, like ambiguity of language or phrasing errors, to perfect and refine the survey experience.

Once you have completed these steps, you can send off your survey with confidence! Even if you’re no stranger to market research, these easy steps can help you maximize the impact of your study and develop strong best practices along the way. 

If you’re ready to get your first (or next) project started, you can engage your target audience directly and efficiently with our online survey and market research tools. With the SightX platform, your consumer surveys can be as simple or complex as you need, with custom design options and complex logic built-in for dynamic delivery.   

Ready to jump in? Request a demo and let us help you get started today!

Estimated Read Time
2 min read

Survey Design: How to Create More Effective Surveys

A survey is often the best way to get information and feedback to use in your decision-making. And the good news is, you don’t have to be an expert to create one! 

While it may seem simple, creating a survey is an important early step in the research process that should not be taken lightly. As the old saying goes, garbage in, garbage out.

The objective of any survey is high-quality feedback that is gathered from your target population. Whether you are engaging customers or employees or even patients, you want to be able to effectively ask questions and get answers that are relevant to the objectives of your research.

So with that in mind, let’s talk about designing a survey that accomplishes all of this.

Set Clear Goals

Before diving into survey creation, it's critical to lay out clear and attainable goals for your research. Are you trying to decide which product concept(s)to move forward with in production? Do you need to figure out why your organization has seen an increasing turnover rate? Or are you interested in finding what treatment has been most effective for a particular patient population? 

Knowing your ultimate objective is imperative in guiding the rest of the survey creation process. 

Define a Target Audience 

Is your target population relatively small and easy to contact? If so, then it may be feasible to survey the entire population. However, if your population is large you have to take into consideration sampling techniques. This allows you to only contact a representative subset of the population in order to draw conclusions about the group as a whole. Stay tuned for more posts about proper sampling techniques.

Design Effective Questions 

It should go without saying, but keep your audience top of mind while writing your survey questions. Make sure your language is direct and easy to understand for your participants. Generally, we find that short specific questions will elicit a higher response rate.  

Be straightforward, and make sure to avoid any potentially biased, leading, or hypothetical questions. Remember that simple words and phrasing will yield more precise answers from your respondents. 

There are many different types of questions that you can use. Some of the most common are: 

Multiple Choice Questions 

Multiple choice questions are, by far, the most commonly used question type. They simply ask your respondents to select one (or more) answers from a list you provide. These types of questions are direct, intuitive, and produce data that is easy to analyze. 

Capture2Image example  of SightX multiple-choice question type

Capture2Image example  of SightX multiple-choice question type


When creating multiple choice questions, we recommend opting for an odd number of answers, like 5 or 7. Forcing respondents to answer a question with an even-numbered scale will bias your end results, as those who are truly neutral will have to select a response that does not represent their feelings. An odd number of answer options will give you more variance and better data for analysis. 

And as for the 5 versus 7 answer scale, the bottom line is: if you’ve spent time debating this, you’ve likely spent too much time thinking about it. It’s far more crucial to focus on effective question creation and setting tangible benchmarks. 


SightX mascot Siggy the owl with a graduation cap
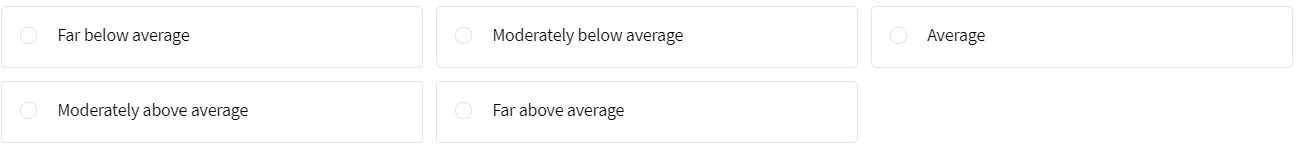
Tip: Remember to create your scales from low to high (e.g. least important to most important, or disagree to agree, etc.).


Multiple-Choice Image Questions

Similar to those above, multiple choice image questions ask your respondents to select one or more images from a group you provide. This type of question works well when you need feedback on creative, design, and visual qualities. 


Grid Questions

Grid, also known as Matrix, questions are simply a series of scale questions grouped together. These types of question groups are handy if you’re asking multiple questions with the same answer options. Often grids are filled with Likert or rating scales. 


Image example  of SightX grid question type

Image example  of SightX grid question type


Rank Order Questions

Ranking questions allow respondents to rank the answer options you provide according to their preference. This can be especially useful to understand the nuances of your audience's preferences, understanding how specific options relate to other's popularity. 


Image example  of SightX rank order question type

Image example  of SightX rank order question type

Image example  of SightX rank order question type


Make sure that your respondents are familiar with all of the answer options you provide, otherwise, the responses may not be reliable. 


SightX mascot Siggy the owl with a graduation cap

Tip: These questions can take much more time for respondents to answer, so only use them when absolutely necessary. 


Rating Scale Questions

Scale, or slider, questions let your respondents rate something within a range you provide. These questions are simple and interactive for your respondents, which can make the overall survey experience more enjoyable. 

 Image example  of SightX rating scale question type

Image example  of SightX rating scale question type

A good use case for a rating scale would be Net Promoter Score questions, as they gauge the likelihood of a consumer to recommend your product or service, on a scale of 1-10. 


Text Entry Questions

Text entry, or open-ended, questions are just that: open-ended questions that allow survey respondents to type their answers into a text box. 

Generally, it is best to use these sparingly. They are often more time-consuming for respondents, and as the data is not quantifiable the data can be more difficult to analyze. That being said, open-ended questions can be good if you’re using Natural Language Processing (NLP) text analysis software, which can enable you to get powerful sentiment and thematic data from your respondents


Heat Mapping Questions

Heat mapping, or click mapping, questions will give you real-time feedback on visualizations. These types of questions will allow respondents to click on specific areas of the image and apply feedback. The information is then sorted into color-coded visualizations based on the type of feedback (positive, negative, neutral) and the frequency of engagement. 


image example  of SightX heat mapping question type


You can utilize heat mapping to gather insights on everything from your product prototypes and design concepts to shelf placement and packaging. This question type will help you understand your user’s experience to better guide your development. 

Keep Your Survey Concise

Much like how we recommend keeping your questions short and to the point, so should the survey itself. Remember that you're asking people to take time out of their busy day to help you out, and usually for free. So the best way to respect their time is by not taking up too much of it! In return, you’ll get higher completion rates and more reliable data. 

The bottom line? Keep it simple, short, and clear. 

Set Expectations Up Front

Don’t leave your respondents in the dark- be sure to provide some background information upfront. Share information about the survey length, sections, and the number of questions at the beginning to ensure respondents know what they will be getting into. Additionally, give your respondents a little context to help them better understand the why behind your survey questions. 

You're likely to get a higher response rate if your recipients know why they were getting the survey, how it will work, and what types of feedback you are looking for. 

Avoid Biased Question & Answer Options 

It may seem like a no-brainer, but don’t ask leading questions. Often when you’re close to a project, it can be easy to accidentally insert your own opinions into your question and answer options. 

But the fact remains- your respondents are less likely to give thoughtful and honest feedback if they feel the question or answer options are leading them in a specific direction. 

There are a few ways to combat this- one of the simplest ways is to include “neutral” answer choices, like “none of the above”, “neutral”, or “other”. Similarly, make sure to word each question with simple and precise language to ensure responses are not influenced one way or another. 

Test Your Survey Before Distribution

This is a simple, yet often-overlooked step in the survey build and design process. Make sure you preview and test your survey before sending it out en masse. This can help to reduce spelling or phrasing errors that might confuse respondents or muddle your message. Similarly, it can help you catch any larger issues too- like missing questions or poor formatting. 

And if you’ve been working closely with the project, it can be helpful to loop in a colleague or two to test your survey for any mistakes you might have simply overlooked.

Surveys with SightX

Utilize SightX survey building tools to engage your audience at any point in the consumer journey and get answers on your pressing product, messaging, brand, or market questions. Design surveys as simple or complex as your use case requires, with all of the flexibility you could ever need. Build projects, distribute your surveys, and analyze the results all in a single, simple-to-use platform. 

Ready to get started? Reach out for a demo today!

Estimated Read Time
6 min read

I Pity The Fool: Correlations, Predictions, and Causations

Nobody likes to be fooled. The majority of us want to know that they are being presented with accurate information about their topic of interest, be it market research, polling results, health related issues, financial trends, or anything else that is data related.

In the age of the data flood, understanding the differences between correlations, predictions, and causation are critical to making sound decisions and not being fooled by a fancy graph. Simply put, correlations mean association. It is mostly measured by a coefficient, Pearson (r), which tells you how much one variable tends to change when the other one does. Any ‘r’ can range between -1 to 1. When ‘r’ is positive, if one variable goes up the other one goes up as well. When ‘r’ is negative it means that when one variable goes up the other goes down. In short, it is about patterns in data.

Predictions on the other hand, while closely related to the concept of correlations in the sense of looking at relationships between two variables, are a bit different. They are about using the statistical techniques of regression models to come up with the best “fit line” of being able to determine one thing by the virtue of knowing the other.

What is critical to note here is just because one variable is correlated with another, or just because one variable is able to predict the other, it does not mean that it is causing it. This is due to the fact that one may not be able to determine things like plausible alternative explanations, time priority, or lack of control.

In order to be able to determine a cause-effect relationship, one needs to rely on randomized controlled experimental designs, where ideally you expose two or more groups to different conditions and you determine the effect of those conditions (variables/ interventions) on your dependent variable (outcome).

The importance of experimental designs will be discussed in a later post.

In the meantime, if you’ve ever wondered how the per capita consumption of mozzarella cheese correlates with civil engineering doctorates awarded, check out the link below. Hint: it’s always a good idea to dig deep into your data and truly understand what you’re looking at and the picture that it paints (read above!).


chart


For even weirder relationships visit, Spurious Correlations.

Estimated Read Time
1 min read

When Science Gets Involved in Politics

“You won’t give me the money to pay for a scientific poll” declared Roger Stone as he separated from the Donald Trump campaign as a senior advisor. What did he mean by that and why is it so important for the voter to know something about it?

There is no shortage of polling results presented on a daily basis. In fact, there are so many of them that many times there are even conflicting results.  Whether you are republican, democrat, or an independent voter, it is important to be able to weed out the good from the bad polling results so you can make informed decisions. How exactly do you do that?

Welcome to inferential statistics.  Sounds complicated and a bit out of your comfort zone?  It shouldn’t be, and here’s why. The principles are much simpler than you think.  In an ideal world, a public opinion poll would reach out to its entire population and ask them about their opinions.  This isn’t really feasible with over 200 million registered voters in the U.S. Because it is not feasible to do so, statisticians opt for sampling techniques; to select cases so the final sample is representative of the population from which it was drawn. A sample can be considered representative if it is able to replicate the important characteristics of the population.  For example, if a population consists of 60% female and 40% male, then a representative sample would have the same ratio composition. The sample should have the same proportional makeup of all important demographic characteristics such as age, location, socioeconomic status, and ethnic background. In other words, a representative sample is similar to the population but on a smaller scale.

How do we guarantee a representative sample? While we could never guarantee 100% representation, we are able to maximize the chances of a representative sample by following the principle of EPSEM (the “Equal Probability of Selection Method”), considered the fundamental principle of probability sampling. Statisticians have developed several sampling  EPSM techniques, including Simple Random sampling (cases are randomly drown from tables or lists), Systematic Random sampling (where a starting point is chosen at random and choices thereafter are at regular intervals), Stratified Random sampling (where you first divide the population list into sub-lists according to important characteristics and then sample from those lists), and Cluster sampling (which involves selecting groups of cases rather than single cases where the clusters are based on important characteristics such as geography).

The EPSM techniques are sound scientific techniques that increase the probability of having a representative sample. Once obtained, statisticians rely on estimation techniques, to estimate population voting based on sample statistics.

So how do we move from sample statistics to inference about the population? Another important concept is something we call Sampling Distribution. It is the distribution of a statistic (such as the mean) for all possible sample outcomes of a certain size.  What is important to understand here is that the sampling distribution is theoretical, meaning that the researcher never obtains it in reality, but it is critical for estimation. Why? This is due to its theoretical properties.  The first being its shape is normal.  You have heard before about the normal or “Bell Curve”, which is a theoretical distribution of scores that is symmetrical and bell shaped. The standard normal curve always has a mean of 0 and a standard deviation of 1.  Furthermore, there are known probabilities that can be calculated based on the mean and standard deviation.

Here are some interesting distributions of the normal curve:

  • The distance between one standard deviation above the mean and one standard deviation below the mean encompasses exactly 68.26% of the total area under the curve
  • The distance between two standard deviations above the mean and two standard deviations below the mean encompasses exactly 95.44% of the total area under the curve

Back to the sampling distribution. First, because one can assume its shape is normal, that leads to the ability to calculate probabilities of various outcomes, if the mean and standard deviation are known (after converting scores to standardized scores known as Z scores, which specify whether a specific score is below or above the mean and by how many standard deviations).

Second, the mean of the sampling distribution is the same value as the mean of the population, and the standard error is equal to the population standard deviation divided by the square root of N. This is a result of the Central Limit Theorem: if repeated random sample of size N is drawn from any population with mean and standard deviation, then as N becomes large, the sampling distribution of sample means will approach normality.

At the end of the day, U.S. voters need to pay attention to the sampling techniques used in these polls. If it isn’t one of the above, then there’s a good chance the results you’re looking at are a bit more misleading than you may think.  Once you know that the sampling technique is sound, it is worth paying attention to the sample size and the confidence intervals involved.

Estimated Read Time
3 min read