Diving into the world of consumer and market research can be a challenge. To help, we’ve put together a glossary of some of the most common terms you will come across.
 Tip: If you are looking for something specific, use Ctrl + F to search for the term(s) you came here to find!
A/B Testing:
A/B Testing (also known as split testing), is the process of comparing two versions of a web page, email or other marketing asset, tagline, package, etc., and measuring the difference in performance. This is done by sharing version A to one target group and version B to the other target group, followed by a set of standard questions, and then evaluating how each variation performs. You can accomplish this in SightX by creating a Concept Test.
ANOVA (Analysis of Variance):
ANOVA is a type of significance testing. It is a statistical method that establishes the existence of a difference between several sample means. While the t-test is used to compare the means of response variable between two groups of predictor variables, ANOVA is used to compare means between two or more groups. So, an ANOVA with only two groups is equivalent to a t-test.
Behavioral Segmentation:
Behavioral segmentation is a type of market segmentation that groups customers together based on their actions like browsing or shopping habits.
Cohort:
A group of people that have a statistical factor (age, gender, etc) in common.
Concept Testing:
Testing on a target market segment employed to evaluate concepts or ideas. The testing results can determine the most appropriate pricing, brand concepts, appeals, and positioning strategy concepts. Get our best tips to optimize your next concept test.
Conjoint Analysis:
A survey-based statistical technique used in market research that helps determine how people value different attributes (e.g. feature, function, benefits) that make up an individual product or service. It is used frequently in testing customer acceptance of new product designs. Read a more in-depth review of Conjoint experiments in our full blog.
Control Group:
A group of people which is used as a cross-reference check for a sample group.
Control Variables:
A variable that is kept the same throughout the experiment, and it is not of primary concern in the experimental outcome. These are often demographic questions that allow researchers to filter, cut, and compare the data by one or more variables.
Demographic Segmentation:
Demographic segmentation is a type of market segmentation that groups customers together based on common traits like age, income, occupation, and more.
Dependent Variable:
Dependent variables are variables that depend on, or are affected by, the independent variables in a study.
Drop-outs:
Respondents who suddenly stop completing the questionnaire. This is different from respondents who were routed to the end of the questionnaire or screened out due to logic (routing).
Focus Group:
A group of people who are brought together to informally discuss a market research question. These individuals are usually contacted by a marketing research company, on behalf of another company.
Gabor-Granger Pricing Technique:
Gabor-Granger is a type of pricing research that can help to determine the price elasticity of products or services. The goal of a Gabor-Granger study is to find the maximum price consumers are willing to pay.
Geographic Segmentation:
Geodemographic segmentation is a type of market segmentation where customers are grouped together in regards to their physical location.
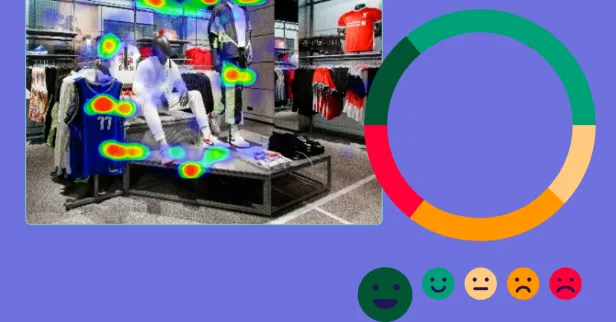
Heat Mapping:
A graphical representation of data where the individual values contained in a matrix are represented as colors. Heatmaps help you get an instant feel for an area by grouping places into categories and displaying their density visually to the researcher. For more information, see our blog on heat mapping.
Independent Variable:
Variation is independent of changes in the values of other variables and is the causative factor. For example, if sales and price were your two variables, price could be the independent variable because it causes sales to increase or decrease (or vice versa).
Likert Scale:
A bipolar scaling method, measuring either positive or negative response to a statement. Likert scales are widely used to measure attitudes and opinions with a greater degree of nuance than a simple “yes/no” question. Typically, either a 5 or 7-point scale is used that ranges from one extreme to another such as Agree to Disagree.
Longitudinal Study:
A longitudinal study is a type of research study conducted over time by observing a specific variable to understand development over time.
Looping (Survey):
Looping logic allows you to route survey respondents through a block of questions based on their answers to specific screening questions. For example: If you ask respondents to choose their favorite brands from a list, you could then ask them questions about each brand “looping” them through the same set of questions each time.
Market Segmentation:
Market segmentation consists of segmenting prospective customers into groups that share common characteristics or needs. This can be done utilizing demographic, geographic, firmographic (B2B), psychographic, or behavioral data. For more information and best practices, see our full blog on market segmentation.
Max-Diff Analysis:
Involves the ‘Best’ and ‘Worst’ scales in a given set. Researchers ask the respondents to pick the most and least important factors in given answer options. Read more in-depth information about MaxDiff experiments on our blog.
Monadic Testing:
Monadic testing is a type of research that introduces survey respondents to a single concept in isolation. This ensures independent findings for each stimulus, unlike comparison tests which allow respondents to see multiple concepts and compare the two.
Machine Learning:
Machine learning is a type of Artificial Intelligence (AI) that allows software applications to “learn” from the data it is fed. These algorithms use statistics to find patterns in the data it accesses and has the ability to provide suggestions or predictions based off of those patterns.
To learn how SightX applies machine learning to market research, see our blog series on Buzzwords.
Nested Quotas:
Nesting allows you to quickly create multiple quotas within a larger sample grouping together (ex: age, gender, ethnicity, etc.). It is when requirements from different quotas are combined together, for example ‘Females in the 18-25 age bracket'.
Piping (Surveys):
Piping allows you to take text from one question or set of answers, and “pipe” it to another set of question or answer options. For example: If you ask respondents to choose their favorite brands from a list, you could then ask them questions about each brand. In the following question blocks about each brand, the brand name would be “piped” from the original question.
Pivot Table:
A statistics tool that summarizes and reorganizes selected columns and rows of data in a spreadsheet or database table to obtain a desired report. The tool does not actually change the spreadsheet or database itself, it simply “pivots” or turns the data to view it from different perspectives.
Psychographic Segmentation:
When you break your customer groups down into units as it pertains to their beliefs, values, interests, and more. It's defined as the psychological aspects that influence consumer purchase behavior such as lifestyle, social status, opinions, and hobbies.
Qualitative Research:
Qualitative research involves collecting and analyzing non-numerical data to better understand consumers' opinions, feelings, sentiments, and more. This type of data cannot be measured traditionally, and is instead analyzed for themes and sentiments for a better understanding of consumer behavior.
Quantitative Research:
Quantitative research strictly uses numerical data to better understand and predict human behavior. Data is collected and analyzed to better understand or predict consumer behavior, market trends, and more.
Quota:
Quotas are the number (or percentage) of respondents needed to meet a specific requirement. Often researchers will use quotas to ensure the sample is representative of the population, or specific audience they are targeting. For example, you may want 51% of your survey respondents to be female, and 49% to be male.
Response Rate:
The actual percentage of questionnaires completed and returned.
Sample:
The population researched through your survey.
Sequential Monadic Testing:
Sequential Monadic testing is a type of research where concepts are evaluated in succession, one after the other. Unlike monadic testing which requires respondents to look at concepts in isolation, sequential monadic testing invites comparison between concepts.
Significance Testing:
Considers the likelihood that the sample data has come from a particular hypothesized population. Statistical significance helps quantify whether a result is likely due to chance or to some factor of interest. In other words, when a finding is significant, it simply means you can feel confident that it's real and not just a matter of who is in the sample.
Survey Logic:
Instructions that are used in the survey design phase to route respondents to particular questions or question sets within the questionnaire. For example, skip logic is used to route respondents around particular questions that do not apply to them. Branching logic is used to route respondents to different locations in the questionnaire based on their responses to a particular question.
Trend Analysis:
Analysis of past and current market behavior and dominant patterns of the market and consumers. An important aspect of conducting trend analysis for an organization is to obtain insights on the market scenario, consumer preferences, and the macroeconomic environment over time.
Van Westendorp's Price Sensitivity Meter:
Van Westendorp’s price sensitivity meter is a method of pricing research that allows you to find the lower threshold, upper threshold, and optimal price point for your product or service.
Share this post