Beyond Buzzwords: Machine Learning & Consumer Insights
Naira Musallam, PhD • 24 Jan 2019
Out of the Weeds, Part I
“Big data is like teenage sex: everyone talks about it, nobody really knows how to do it, everyone thinks everyone else is doing it, so everyone claims they are doing it.”
Famously stated by Dan Ariely, a Professor of Psychology and Behavioral Economics at Duke University.
We would argue the same holds true for the latest generation of buzzwords. Do artificial intelligence (AI), machine learning (ML), or natural language processing (NLP) ring a bell?
We’ve put together a series of blogs that will shed some light on these, and other related terms, to help cut through the technical jargon and provide explanations for concepts that can feel a bit overwhelming.
For the first installation in our series, we are focusing on machine learning, a branch of AI that automates analytical model building, where systems can learn from data and identify patterns.
Our primary goals for this piece are two-fold:
-
- Clarify the meaning of machine learning
- Show its relevance and practical applications to consumer insights and market research teams.
To make things simple, let’s begin with a use case:
As a consumer insights or market research professional, one of your goals for the year may be to improve your consumer segmentation – the practice of dividing your customer base into groups based on some shared characteristics. How do you go about it? Well, there are four primary types of consumer segmentation:
- Demographic: This method groups consumers based on variables such as age, gender, sexual orientation, family size, marital status, ethnicity, etc.
- Behavioral: Segments consumers based on behaviors, such as product preferences, shopping patterns and frequencies, or types of purchases and consumption.
- Psychographic: Utilizes psychological profiling to group consumers based on their lifestyle, values, motivations, interests, and opinions.
- Geographic: Categorizes consumers based on their physical location, including their country, state, or city.
When analyzing your audience, there are two techniques you can choose to use. The first deals with well-defined variables, like demographic and geographic segmentation. This allows you to divide your audience by age, sex, ethnic group, or location.
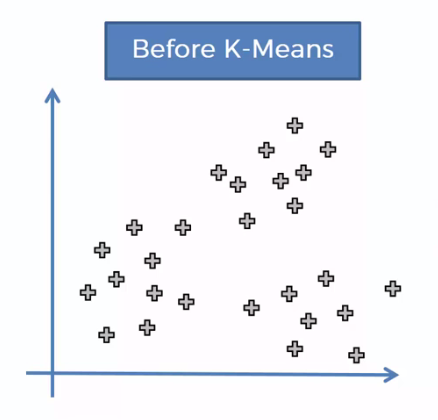
However, some variables are not as well-defined, these usually fall into the behavioral and psychographic categories. Think about the data you receive when asking your potential audience, “On a scale of 1 to 10, how likely are you to purchase this?” The data collected is likely to look more like a scatter plot than a clean, well-defined grouping of responses.

Because psychographic and behavioral data points typically fall along a scale, they are inherently less-defined than demographic or geographic data.
So, how do you segment less-defined data?
One way to go about it is to introduce your own set of parameters for the data, assigning low, medium, or high cut-offs. However, this approach projects your own assumptions about how the data should behave in relation to other variables, rather than just analyzing the actual behavior.
Okay, so now what? This is where Machine Learning comes in!
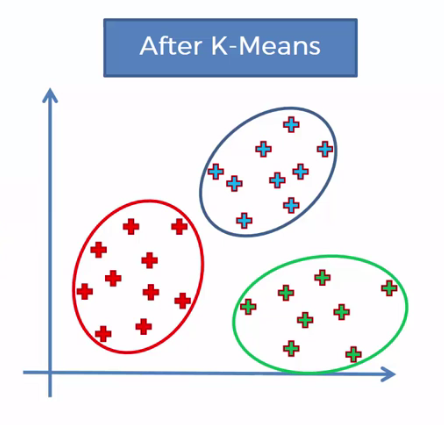
In this case, we would use what is called “unsupervised learning”, specifically, a method known as k-means clustering. The premise of which is to conduct an iterative process of grouping widespread data points into several clusters that are well organized and accurate.
For the technically-minded, k-means starts by identifying clusters of data points of comparable spatial extent (i.e. they are close together and enclosed by a theoretical rectangular shape). The center of this rectangle, the intersection of two diagonals, is what is called the centroid.
After defining these centroids, the algorithm iterates and repeats to perform two things:
- Assign each data point to the closest corresponding centroid.
- For each centroid, calculate the mean of the values of all the points belonging to it.
The goal of this process is to group various data points into the most accurate clusters or segments. Note that we didn’t say anything about assumptions around who these groups of consumers were.

The results we see are cleanly organized into groups of consumers. But they aren’t organized around a well-defined variable like age or gender. Instead, they are formed by how they, as individuals, responded to the questions.
If you’ve collected the right types of data, you can then segment consumers who are clustered together based on preferences or opinions, and view the resulting breakdown of the demographic variables attributed to that segment.
You can use this newly defined segment, created through machine learning, to target consumers more efficiently than by utilizing a singularly defined variable alone.
No matter the type of organization, it is always beneficial to know your audience on a deeper level, understanding them beyond simple demographic information. Deploying a thoughtful research strategy, coupled with the power of machine learning techniques can lead to powerful results.
If you're ready to kick your research up a notch with machine learning, request a demo today!

