Home

Main navigation

  • Why SightX?
  • Meet Ada
  • Capabilities
      • Audience Segmentation

        Create more accurate market segments

      • Heat Mapping

        Test consumer engagement

      • Brand Tracking

        Track the brand KPIs that matter most

      • Key Driver Analysis

        Pinpoint your key drivers of success

      • Concept Testing

        Screen ideas and perfect your concepts

      • MaxDiff Analysis

        Learn how customers rank your product features

      • Conjoint Analysis

        Optimize your product’s packaged features

      • Gabor-Granger

        Maximize product revenue without compromising demand

      • Text Analysis

        Reveal powerful sentiments about your brand and products

      • Van Westendorp

        Explore price sensitivity and find your ideal price point

      • TURF Analysis

        Appeal to the maximum number of people in the most efficient way

      • Significance Testing

        Uncover significant insights within your data sets

      • Online Panels

        Connect with millions of people across the globe

      • Survey Software

        Create surveys as simple or complex as you need

      • Research Services

        Work with our team of experts

  • Solutions
    • Use Cases

      Browse solutions by Use Case

      • brand tracking icon Brand Tracking
      • content creation Content Creation
      • customer experience Customer Experience
      • marketing advertising Marketing & Advertising
      • pricing strategy Pricing Strategy
      • product development Product Development
    • Teams

      Browse by Role

      • Research and Insights Research and Insights
      • Product Managers Product Managers
      • Marketers Marketers
      • Brand Managers Brand Managers
      • Investors Investors
  • Customers
  • Pricing
  • Resources
    • Blog

      Research insights and industry trends

    • Glossary

      Key market research terms, clearly explained

Login
Get Started

Exploring Market Research
Trends & Insights

Must-Read Headlines
SightX logo next to ZS logo

SightX News

SightX and ZS Partner to Transform Consumer Research

SightX and ZS have joined forces to revolutionize consumer research, combining agile, AI-enabled technology with deep strategic consulting expertise. This first-of-its-kind partnership enables brands...

2 min read

30 Apr, 2025

SightX News

Series of vertically narrow screens, each displaying separate images with attribute callouts part of a survey, set against a purple background

SightX Feature Focus: Custom Visualization & Branding Suite

SightX’s new Custom Visualization & Branding Suite transforms the way you present consumer research by making...

1 min read

7 Apr, 2025

Customers

Insights

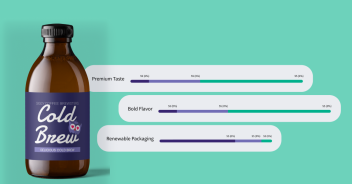
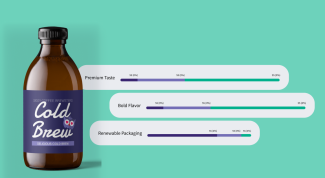
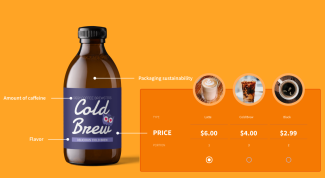
Cold brew glass bottle set against a green background, accompanied by three attributes and bar graph results showing consumer preference toward each attribute

How Pabst Brewing Combines Heritage and Innovation to Drive Growth

Pabst Brewing Company, a leader in blending heritage with innovation, partnered with SightX to overcome research...

3 min read

24 Mar, 2025

Research Resources

Concept illustration of canned beverages with poured drinks in front, set against a purple background, surrounded by viewer sentiment reactions with smiling, neutral, and sad face emojis

2025 Consumer Research Trends

The consumer research industry is rapidly transforming, driven by technological advancements, a heightened focus on data...

6 min read

20 Nov, 2024

Search the blog

Categories

Affordable, smarter research. Unlock innovation faster today.

Request a Demo
Series of vertically narrow screens, each displaying separate images with attribute callouts part of a survey, set against a purple background

Key Methods for Optimal Market Segments &…

Have you considered that your customers are more diverse than your messaging,…

1 min read 29 June, 2021
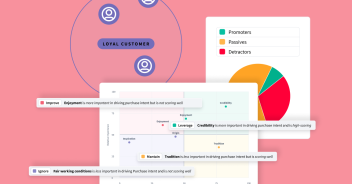
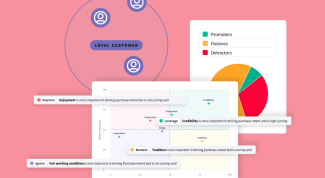
Various charts displaying key drive analysis outputs combined with customer segmentation insights, set against a pink background

Maximizing ROI in Marketing Campaigns - Are You…

It’s always good to get a pulse of the market, the trends, the expectations,…

2 min read 23 June, 2020
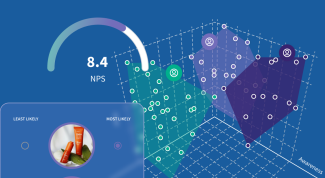
3D graph analyzing multiple variables, mapping persona clusters at key intersections, set against a blue background

Information vs. Intelligence

If you’ve ever worked in the military, cybersecurity, or even corporate…

2 min read 23 June, 2020
Glass bottle of cold brew being evaluated by survey respondents for various attributes using heat mapping, set against a yellow background

An Intro to Significance Testing for Market…

If you work in the market research and insights space, you've likely come…

5 min read 21 September, 2022
Mobile device displaying a survey question about product attribute preferences, set against a red background

What is Logo Testing? How to Do It with Our…

As any branding expert knows- your logo says a lot about you.

2 min read 31 March, 2022
Various charts displaying key drive analysis outputs combined with customer segmentation insights, set against a pink background

What is Ad Testing? Is it Important? [With Free…

From differences across platforms, formats, and audiences- creating ads that…

4 min read 6 December, 2022
Cold brew glass bottle set against a green background, accompanied by three attributes and bar graph results showing consumer preference toward each attribute

What is Message and Claim Testing? How to…

We live in a noisy world, constantly bombarded by advertising and branded…

3 min read 27 September, 2022
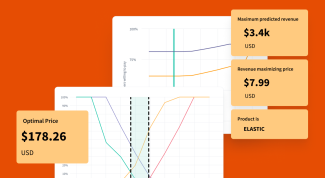
Two line charts with callouts illustrating pricing research insights, showing the optimal price point, set against an orange background

The 5 Types of Market Segmentation

Whether you're launching a marketing campaign or releasing a new product…

5 min read 7 September, 2023
Cold brew glass bottle set against a green background, accompanied by three attributes and bar graph results showing consumer preference toward each attribute

What is Conjoint Analysis? Answering the Most…

If you work in or around market research, you have most likely used or (at the…

7 min read 6 July, 2020
3D graph analyzing multiple variables, mapping persona clusters at key intersections, set against a blue background

Why You Should Be Using Text Highlighter…

In a world overflowing with information, we are all constant consumers of text…

4 min read 27 September, 2023

Pagination

  • Previous page Previous
  • …
  • Page 12
  • Page 13
  • Page 14
  • Page 15
  • Page 16
  • Page 17
  • Page 18
  • Page 19
  • Page 20
  • …
  • Next page Next

Ready to meet the next generation
of market research technology?

A market research platform for the future

Get Started
SightX Footer Logo
The Future of Consumer Research

Footer First Column Menu

  • Why SightX?
  • Meet Ada
  • Capabilities
  • Solutions
  • Industries

Footer Second Column Menu

  • Blog
  • Pricing
  • Careers
  • Request a demo

Footer Third Column Menu

  • SightX vs Qualtrics
  • SightX vs Alchemer
  • SightX vs QuestionPro
LinkedIn social icon
Facebook social icon
SightX X Social account
© 2025 SightX. All rights reserved.

Terms and Privacy Links

  • Terms of Service
  • Privacy Statement