Exploring Market Research
Trends & Insights
Must-Read Headlines
SightX Joins Rep Data to Accelerate the Future of End-to-End, High-Quality Research
SightX has been acquired by Rep Data, bringing together an end-to-end research platform with full-service data collection and industry-leading response quality infrastructure. The partnership...
2 min read
14 Apr, 2026
Case Studies & eBooks

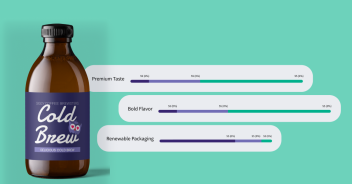
How Mowi Found Clarity in a Complex Category: The Power...
In a complex and rapidly evolving seafood category, Mowi, the world’s largest Atlantic salmon company, turned...
2 min read
14 Oct, 2025
SightX News
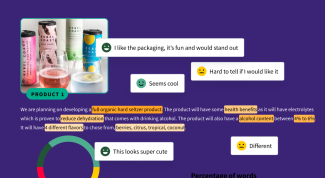
Introducing Asynchronous Video Interviews: Humanizing Insights, at Scale
SightX now offers native asynchronous video interviews, enabling researchers to capture authentic, emotive feedback directly within...
1 min read
26 Aug, 2025
SightX News
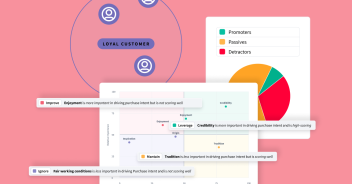
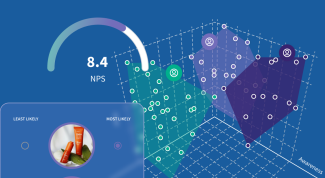
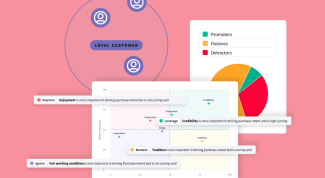
Advanced Automated Segmentation: Smarter Insights for Every Team
SightX’s new Advanced Automated Segmentation marks a leap forward in audience understanding. This capability delivers the...
2 min read
27 Oct, 2025