Quantitative methodologies are crucial in uncovering actionable product development and market insights.
Leveraging quantitative product research techniques, you can gather valuable data, analyze trends, and make well-informed decisions that drive innovation and market success. Today, we will cover ten quantitative research methodologies commonly used in product development, highlighting applications, advantages, and real-world examples.
Surveys
Surveys are the bread and butter of quantitative research, providing a structured approach to collecting data from a robust sample of respondents. Whether conducted online, via phone, or in person, surveys allow you to gather insights into consumer preferences, behaviors, and attitudes. By asking standardized questions and analyzing responses statistically, you can identify trends, patterns, and correlations that inform product development and marketing strategies.
Consumer Electronics Survey Example
A consumer electronics company would use surveys to gather feedback on their new smartphone model. The survey could assess features, pricing preferences, and brand perceptions to guide product development and positioning strategies.
Experiments
Experiments involve manipulating variables and measuring their effects on outcomes in a controlled setting. Whether conducted in a laboratory or real-world environment, experiments allow you to test hypotheses, establish causality, and quantify the impact of specific interventions.
By randomizing participants and controlling extraneous variables, you can draw reliable conclusions about the efficacy of product features, marketing messages, and pricing strategies.
Beverage Company Experiment Example
Beverage companies often conduct taste testing to assess consumer preferences for different formulations of new drinks. In these studies, participants are randomly assigned to taste samples of the product and provide feedback on taste, flavor, and overall satisfaction, helping the company perfect its recipe for maximum appeal.
Observational Studies
Observational studies involve observing and recording behaviors, events, or phenomena in their natural setting. Whether conducted through direct observation or video recording, observational studies provide valuable insights into consumer behaviors, product usage patterns, and environmental factors.
By capturing real-world data, you can identify trends, patterns, and opportunities for innovation.
Retail Observational Study Example
Retail chains use in-store observational studies to analyze shopper behavior and store layout effectiveness. Researchers observe traffic flow, product interactions, and purchase decisions, identifying areas for improvement in merchandising and product placement.
Regression Analysis
Regression analysis is a statistical technique used to quantify the relationship between one or more independent variables and a dependent variable. Whether linear or nonlinear, regression analysis helps you model and predict outcomes based on observed data.
By identifying correlations and estimating the strength of relationships, you can make informed decisions about product features, pricing strategies, and market positioning.
Software Company Regression Analysis Example
A software company may want to conduct a regression analysis to assess the impact of ad spend on app downloads. By analyzing historical data, the company can quantify the relationship between the two variables and optimize its marketing budget allocation for maximum impact.
Conjoint Analysis
Conjoint analysis is a quantitative technique used to measure consumer preferences for different product attributes or features. Whether conducted through choice-based or rating-based methods, conjoint analysis enables researchers to assess the relative importance of product attributes and estimate utility values for different combinations.
Conjoint analysis simulates real-world purchase decisions, which allows you to identify optimal product configurations and pricing strategies that maximize consumer satisfaction and willingness to pay.
Automotive Conjoint Analysis Example
Car manufacturers often use conjoint analysis to determine the ideal combination of features for their models. By presenting respondents with different configurations of features (e.g., engine size, fuel efficiency, interior amenities) and prices, the company identifies the most attractive product offering that aligns with consumer preferences and market demand.
Trend Analysis
Trend analysis involves examining historical data to identify patterns, trends, and changes over time. Whether conducted through time series analysis or statistical modeling, trend analysis enables researchers to forecast future outcomes and anticipate market trends.
Analyzing trends in sales data, consumer behavior, and macroeconomic indicators, you can identify emerging opportunities, mitigate risks, and adapt your strategies to changing market conditions.
Retail Trend Analysis Example
A fashion retailer would conduct a trend analysis to identify seasonal buying trends and predict future demand for clothing styles. By analyzing historical product sales data, the retailer can anticipate shifts in consumer preferences and adjust its inventory and marketing strategies accordingly.
Net Promoter Score (NPS)
Net Promoter Score (NPS) is a metric used to measure customer loyalty and satisfaction based on the likelihood of customers recommending a product or service to others.
Whether measured through surveys or other customer feedback mechanisms, NPS helps you quantify customer sentiment and track changes over time. By assessing promoter, detractor, and neutral responses, you can identify areas for improvement and prioritize initiatives to enhance customer satisfaction and loyalty.
Hospitality NPS Example
A hospitality company would use NPS surveys to measure guest satisfaction and loyalty at its hotels and resorts. By collecting feedback from guests after their stay and calculating NPS scores, the company identifies areas for improvement in service quality, amenities, and overall guest experience.
Market Segmentation Analysis
Market segmentation analysis involves dividing a heterogeneous market into distinct segments based on demographic, psychographic, or behavioral characteristics. Whether conducted through clustering techniques or statistical modeling, market segmentation helps you identify target audiences with similar needs, preferences, and buying behaviors.
With this data, you can your tailor products, messaging, and distribution strategies to specific segments to maximize relevance and effectiveness.
CPG Market Segmentation Example
A food and beverage company would conduct market segmentation analysis to identify ideal buyers for a new line of organic snacks. By analyzing demographic data, lifestyle preferences, and purchasing behaviors, the company can identify health-conscious consumers as a primary target market and tailor its product offering and marketing messaging accordingly.
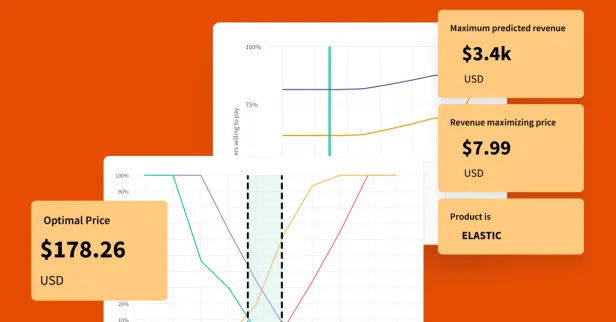
Price Sensitivity Analysis
Price sensitivity analysis involves assessing consumer willingness to pay for a product or service at different price points. Whether conducted through price elasticity modeling based on Van Westendorp, Gaber-Granger, or any alternative method, price sensitivity analysis helps you understand how changes in price impact demand and revenue. You can maximize profitability while remaining competitive in the marketplace by identifying price thresholds and optimal pricing strategies.
Smartphone Price Sensitivity Analysis Example
An electronics company would use price sensitivity analysis to determine the optimal pricing strategy for a new line of smartphones. By presenting respondents with different price options and measuring purchase intent, the retailer identifies the price point that maximizes sales volume and revenue while maintaining profitability.
Customer Lifetime Value (CLV) Analysis
Customer Lifetime Value (CLV) analysis involves quantifying the long-term value of a customer to a business based on their projected revenue and contribution over their entire relationship. Whether calculated through predictive modeling or cohort analysis, CLV analysis enables you to identify high-value customers, optimize acquisition and retention strategies, and allocate resources effectively. Focusing on customer lifetime value maximizes revenue, profitability, and customer satisfaction over time.
CLV Analysis for Streaming Company Example
A subscription-based streaming services will often use CLV analysis to identify their most valuable customers and tailor retention strategies accordingly. The service identifies opportunities to increase engagement, reduce churn, and maximize lifetime value by analyzing customer behavior, usage patterns, and subscription tenure.
Quantitative Market Research with SightX
Historically, research and insights work was costly, time consuming, fragmented, and not widely shared....so we decided to change that.
SightX is an AI-driven market research platform offering a single unified solution for product, brand, marketing, and pricing research. While powerful enough for insights teams at Fortune 500 companies, our user-friendly interface makes it simple for anyone to start, optimize, and scale their research.
With our new Generative AI consultant, Ada, you can harness the power of OpenAI's GPT to transform your marketing research and insights. Collaborating with Ada is like having an expert researcher, brilliant statistician, and ace marketer on your team, helping you ask the right questions, choose the best experiments, pick out key insights, and seamlessly apply them to your business.
Share this post