Ready, Steady, Grow

SightX co-founder, Naira Musallam, teamed up with our partners at Google and Summit Media to discuss what happens after COVID-19 in the retail world.

How do you expect consumers to get back into the retail environment?

Learn key consumer insights that will inform decision making across the retail environment, trends to inform the 'new normal' for consumers, and more.

Tune in to a replay of the webinar here.

Estimated Read Time
1 min read

Beyond Buzzwords: Decision Trees

Out of the Weeds, Part III

In this series of articles, our goal has been to demystify some of the common buzzwords being used in our industry and show how they are relevant and practical to consumer insights.

In case you missed the first installment in this series- machine learning is a branch of artificial intelligence that automates analytical model building, where systems can learn from data and identify patterns.

This third installment is all about decision trees, how they are used, and the implications for consumer research.

Decision trees- a predictive modeling approach in machine learning- use observations about a certain item to help make conclusions about the item’s target value.

You don’t need to understand how to build the models yourself to be able to utilize the power of these and other ML techniques. (hint: call us)

What Are Decision Trees? 

Decision trees are a non-parametric supervised learning method used for both classification and regression (prediction) tasks. Non-parametric simply means that fewer assumptions are made about the population, or rather the data is not required to fit a normal distribution.

That is not meant to imply that such models completely lack parameters, but that the number and type of parameters are flexible and not pre-fixed. Non-parametric data is also often ordinal in nature.

For example, a survey of consumers asking their preferences on a range from Dislike to Like (or any other type of Likert scale) would be considered ordinal data.

Supervised learning is the machine learning task of inferring an output given an existing labeled data set. Whereas unsupervised learning seeks to uncover the hidden structure/pattern within an unlabeled data set.

The primary goal of a decision tree algorithm is to build a model that classifies and then predicts the value of a variable or outcome by learning a series of simple rules inferred from the structure of the data. The most common “rule” is in the format of an “if/then” statement.

Decision tree algorithms are considered to be a class of powerful models for their ability to achieve a high accuracy, while also being both clear and interpretable (e.g. "we believe with a high degree of certainty that our customers will behave in this way.")

Decision trees play into our decisions as consumers at all points during the day. With some effective research, it’s possible to get a better understanding of where and how consumers navigate those choices

How do you start your day?

The tree can be as simple or as complex as the situation requires. All decision trees enable users to develop a classification system that can predict an outcome of a certain interest or topic. For example, how likely is a certain segment of consumers to make a purchase?

How Does it Work? 

There are several methods used to build the actual classification system. All of them more or less accomplish the same thing: they classify and then make predictions.

The choice of a particular algorithm is largely dependent on whether you are attempting to predict a continuous variable (e.g. rating scale) or a categorical variable (e.g. gender, specific income level, etc.). Then, of course the level of complexity of the actual variable itself. A binary Yes/No is less complex than a three level categorical variable, Yes, No, Maybe.

Another way to describe a machine learning decision tree is as a Classification and Regression (C&R) Tree. Same as before, the C&R Tree algorithm generates a decision tree that allows you to predict or classify future observations.

This method uses a recursive partitioning to split the records into segments of either predicting the values of a continuous variable (regression) or predicting the values of a categorical dependent variable from one or more continuous and/or categorical predictor variables.

A C&R tree node is considered “pure” if all cases in the node fall into a specific category.  The C&R Tree node input fields can be numeric or categorical, while all of the splits are binary.

For example, we may be interested in predicting who will or will not be a repeat purchaser or renew their subscription.

Another, similar type of tree building algorithm is the CHAID node method, which uses Chi Square statistics to identify ultimate splits, allowing for the splits to expand beyond two branches- perhaps a topic we can dive deeper into later!

How (and When) To Use Decision Trees

The use cases for using a decision tree based algorithm in the world of consumer insights are numerous and probably used more than you may have thought.

Among the more common applications are:

  • Segmentation: Identify consumers who are likely to be influenced
  • Stratification: Assign consumer segments into various categories (e.g. low, medium, high levels of loyalty)
  • Prediction: Create rules to predict a related outcome (e.g. likelihood of purchase versus no purchase)
  • Consumer Journey mapping: Classifications and predictions to map out a specific consumer journey

Happy Growing!

Estimated Read Time
3 min read

Beyond Buzzwords: Machine Learning & Consumer Insights

Out of the Weeds, Part I

“Big data is like teenage sex: everyone talks about it, nobody really knows how to do it, everyone thinks everyone else is doing it, so everyone claims they are doing it.”

Famously stated by Dan Ariely, a Professor of Psychology and Behavioral Economics at Duke University.

We would argue the same holds true for the latest generation of buzzwords. Do artificial intelligence (AI), machine learning (ML), or natural language processing (NLP) ring a bell?

We’ve put together a series of blogs that will shed some light on these, and other related terms, to help cut through the technical jargon and provide explanations for concepts that can feel a bit overwhelming. 

For the first installation in our series, we are focusing on machine learning, a branch of AI that automates analytical model building, where systems can learn from data and identify patterns.

Our primary goals for this piece are two-fold: 

    • Clarify the meaning of machine learning
    • Show its relevance and practical applications to consumer insights and market research teams.

To make things simple, let’s begin with a use case: 

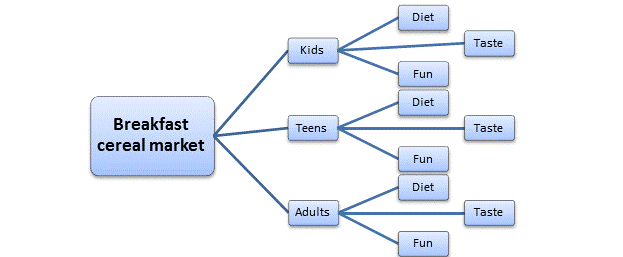
As a consumer insights or market research professional, one of your goals for the year may be to improve your consumer segmentation – the practice of dividing your customer base into groups based on some shared characteristics. How do you go about it? Well, there are four primary types of consumer segmentation:

  • Demographic: This method groups consumers based on variables such as age, gender, sexual orientation, family size, marital status, ethnicity, etc.

  • Behavioral: Segments consumers based on behaviors, such as product preferences, shopping patterns and frequencies, or types of purchases and consumption. 

  • Psychographic: Utilizes psychological profiling to group consumers based on their lifestyle, values, motivations, interests, and opinions. 

  • Geographic: Categorizes consumers based on their physical location, including their country, state, or city.

When analyzing your audience, there are two techniques you can choose to use. The first deals with well-defined variables, like demographic and geographic segmentation. This allows you to divide your audience by age, sex, ethnic group, or location.

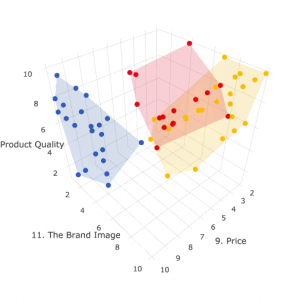
However, some variables are not as well-defined, these usually fall into the behavioral and psychographic categories. Think about the data you receive when asking your potential audience, “On a scale of 1 to 10, how likely are you to purchase this?” The data collected is likely to look more like a scatter plot than a clean, well-defined grouping of responses.


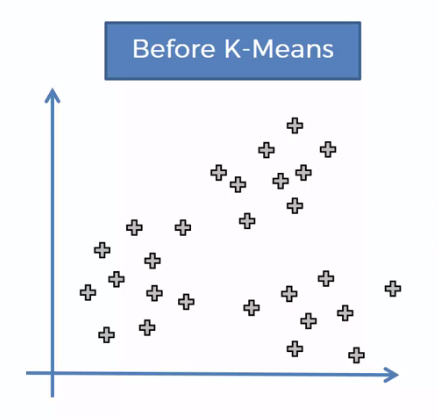
Scatter plot prior to K-Means Clustering

Because psychographic and behavioral data points typically fall along a scale, they are inherently less-defined than demographic or geographic data. 

So, how do you segment less-defined data? 

One way to go about it is to introduce your own set of parameters for the data, assigning low, medium, or high cut-offs. However, this approach projects your own assumptions about how the data should behave in relation to other variables, rather than just analyzing the actual behavior. 

Okay, so now what? This is where Machine Learning comes in!

In this case, we would use what is called “unsupervised learning”, specifically, a method known as k-means clustering. The premise of which is to conduct an iterative process of grouping widespread data points into several clusters that are well organized and accurate.

For the technically-minded, k-means starts by identifying clusters of data points of comparable spatial extent (i.e. they are close together and enclosed by a theoretical rectangular shape). The center of this rectangle, the intersection of two diagonals, is what is called the centroid.

After defining these centroids, the algorithm iterates and repeats to perform two things:

  • Assign each data point to the closest corresponding centroid. 
  • For each centroid, calculate the mean of the values of all the points belonging to it.

The goal of this process is to group various data points into the most accurate clusters or segments. Note that we didn’t say anything about assumptions around who these groups of consumers were.


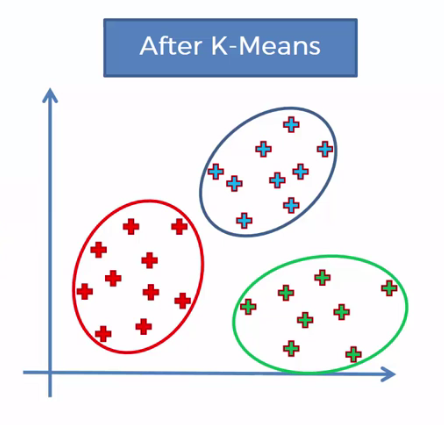
After K-Means Clustering

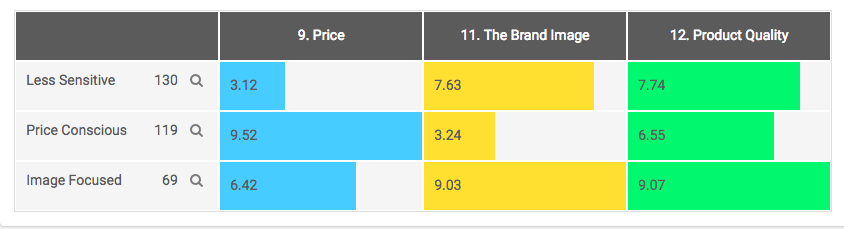
The results we see are cleanly organized into groups of consumers. But they aren’t organized around a well-defined variable like age or gender. Instead, they are formed by how they, as individuals, responded to the questions.

If you’ve collected the right types of data, you can then segment consumers who are clustered together based on preferences or opinions, and view the resulting breakdown of the demographic variables attributed to that segment.

You can use this newly defined segment, created through machine learning, to target consumers more efficiently than by utilizing a singularly defined variable alone. 

No matter the type of organization, it is always beneficial to know your audience on a deeper level, understanding them beyond simple demographic information. Deploying a thoughtful research strategy, coupled with the power of machine learning techniques can lead to powerful results.

If you're ready to kick your research up a notch with machine learning, request a demo today!


Estimated Read Time
3 min read

Reinventing Consumer Insights with A.I. Driven Analytics & Curiosity

The future of our industry is agile research technology that provides automated insights.

For many years, quantitative research technology solutions have focused on automating the data collection and reporting process. But what about the analytics process, which is often tedious and time consuming?


What if you could design experiments and engage your target audience to understand the ‘why’ behind their behaviors, sentiments, and thoughts instantly?

SightX partnered with Women in Research (WIRe) to discuss how AI-driven analytics can go far beyond automated data collection and visualization, to deliver truly automated insights. We shared technological innovations and best practices that will allow you to move away from endless number crunching and give you back the time needed to focus on actual solutions. You know- what you were actually hired to do!

In this webinar we…

  • Uncover new AI driven analytical techniques available to insights teams.
  • Demonstrate real world examples of businesses uncovering insights, utilizing AI driven analytics, that if taken at first glance would have never resulted in positive outcomes
  • Share case studies showcasing how automated analytics can uncover previously unknown and unseen consumer segments.

Listen to the Webinar here!

If you're interested in learning more, reach our directly to sales@sightx.io 

And, as always, Be Curious!

Estimated Read Time
1 min read

Consumer Segmentation: Maybe You Could Be Doing It Better

Have you ever considered that your customers may be more diverse than your marketing?

How well do you really know them? What do your target segments look like? Do your marketing campaigns reflect what you know about them?

When it comes to consumer segmentation, most brands divide their customers into groups based on common predetermined characteristics, allowing them to change their messaging depending upon the segment. But how can you know for sure if those are the most accurate segments to engage? 

If your sole method of understanding your customers is through demographic segmentation, then at best your understanding is limited and, at worst, it’s incomplete or misleading.

Because of this fact, we believe in letting the data itself reveal the customer personas that naturally exist.

First, Some Context

Today, we live in a “post demographic” world. Simply put, this  means consumers have changed. The way we all interact with brands has evolved considerably in recent years. Consumers continually construct and reconstruct their own identities, rebelling against top-down driven “norms” handed to them by the advertisements of old. The clear delineations between consumers based on gender, age, income, education, or ethnicity are not as useful as they once seemed.

Take, for example, a young woman working in finance with a high level of disposable income and a middle-aged man working in education with a lower level of disposable income. From the outside it might seem that these two wouldn’t have much in common. However, they very well may have more values or experiences in common than demographic data alone would suggest.  

In this world, where commonality is not defined by demographics, the ramifications of sub-standard consumer segmentation are massive; ultimately leading to mediocre brand messaging, marketing campaigns, and advertising.

Real World Applications 

Suppose you conduct a market research project to understand how likely consumers are to purchase a new household good. For this project, you collect data from 1,000 respondents, from general demographic information to price, brand image, and quality sensitivity. 

Traditional consumer segmentation methods may have revealed that females are much more likely to purchase your new household product than their male counterparts . Or perhaps when you cut the data according to age, you found out that Gen Z cared more about brand image than Gen X did.

But, is that truly the only way these consumers are similar? Age and gender alone? Let’s circle back to our original suggestion and let the data to do all the talking. We can do this by using a type of machine learning algorithm known as unsupervised learning. This allows us to segment the data according to how the data behaves and cluster consumers into the most homogenous and efficient groups.

The results may show something like the graph below; a three-dimensional cluster analysis where the similarities shared in each group are based on how important quality, image, and price were, not based on a predetermined demographic split. With this information mapped out, each persona tells us a different story.

The first cluster, denoted in red on the graph above, scored low on sensitivity to price, but higher on product quality and brand image. The second cluster, in blue, scored much higher on price sensitivity, lower on caring about product quality and lower on brand image, while the third cluster, in yellow on the graph, scored medium on price, and the highest on caring about both product quality and brand image.


The interesting part? Each cluster is a mix of demographic variables!

All of these unique personas can tell us what these consumers value and, by extension, what type of messaging resonates with them.

Best Practices to Keep in Mind

Remember, the purpose of learning is growth. So collecting the right data is only half of the equation, you’ve then got to make sure you use that data in the right ways. To do just that, keep in mind the following:  

  • Demographics never tell us the whole story. To understand your audience, you have to collect data related to who they are, what they value, and what motivates them.
  • Consumer  behavior is constantly shifting and evolving. If you want to keep pace, conduct market segmentation frequently to ensure your marketing is up to date and on target for results.
  • By collecting data about consumer’s online habits, you can refine your strategies further. Just make sure to adapt your marketing plan to meet the motivations of these newly discovered market segments.
  • Complement traditional consumer segmentation with machine learning processes, like those applied by SightX. Every statistical method comes with its own set of assumptions. Even "no assumption" is an assumption. 
  • Always be open to learning from the data you collect, whether it confirms your strategy or challenges your thinking.

When it comes down to it, staying relevant to your audience is the only way to build long-term brand equity and loyalty. SightX allows you to use multiple tools to create and discover your consumer segments. Manually develop predetermined segments, or let our platform automatically create them for you based on behavioral or psychographic data. 

It really can be that simple.


Estimated Read Time
3 min read