How to Analyze Survey Results: A Guide for Unlocking Consumer Insights
Before jumping to analysis, let’s start by noting the obvious, that many surveys use a mixed-methods approach, combining both closed- and open-ended questions. This approach allows researchers to gather broad quantitative data for statistical purposes while also collecting qualitative data that adds necessary context and depth.
What is quantitative data? What is qualitative data? What are their key differences?
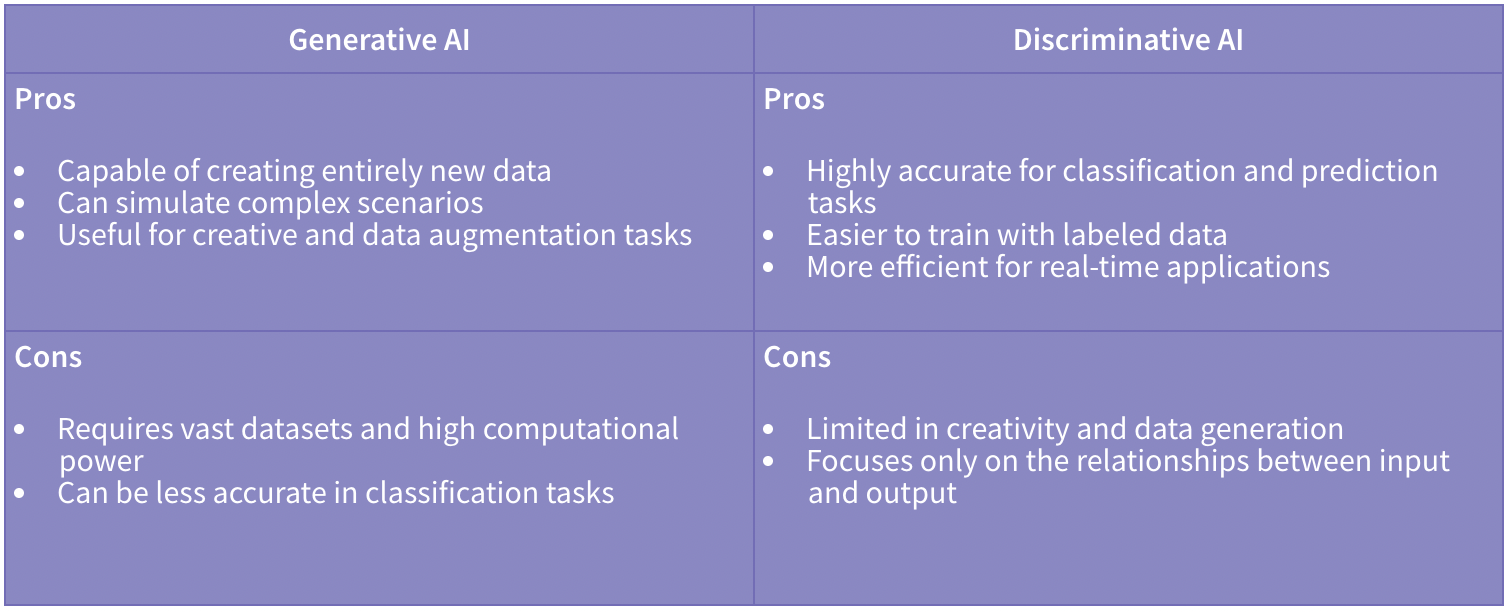
Quantitative data refers to information that can be measured and expressed numerically. It involves quantities, amounts, and numerical values that allow for statistical analysis. This type of data can be counted, measured, and compared in terms of numbers and often includes metrics like height, weight, age, temperature, and test scores. Quantitative data is typically used when objective, measurable information is needed, and it answers questions like "how many," "how much," or "how often."
In contrast, qualitative data refers to descriptive information that characterizes but doesn’t measure. This data type provides insights into qualities, characteristics, and attributes and is often collected through methods like interviews, observations, and open-ended surveys. Qualitative data might describe things like color, texture, emotions, experiences, or preferences and answers questions like "what kind," "how," or "why."
Key differences
- Nature of Data: Quantitative data is numerical, while qualitative data is descriptive.
- Purpose: Quantitative data focuses on quantifying characteristics, while qualitative data explores understanding and depth.
- Analysis Methods: Quantitative data is analyzed using statistical methods, whereas qualitative data is often analyzed through thematic or content analysis.
Surveys are powerful tools that can help you understand what your customers think, feel, and need. But collecting data is just the first step; the real value comes from analyzing it in a way that reveals actionable consumer insights. In this guide, we’ll walk you through a structured approach to analyzing survey data like a data pro. Whether you’re in marketing, product development, or customer service, these steps will help you make informed, data-backed decisions.
Step 1: Prepare Your Data for Analysis
Before diving into analysis, it’s essential to clean and organize your data to ensure accuracy and consistency.
Clean Your Data
Cleaning data involves removing incomplete responses, addressing any obvious errors, and checking for consistency. For instance, if you notice multiple entries with the same IP address or duplicates, consider filtering these out, as they could skew the results.
Organize and Categorize Responses
For easier analysis, organize responses by key demographics, segments, or categories. For example, if you’ve collected age and gender data, segmenting responses by these variables can help you identify trends within specific groups.
Example: Segmenting responses by age group can help identify patterns, such as younger consumers preferring digital communication channels over in-store experiences.
Standardize Formats
To compare data consistently, ensure that you’re using standard formats. For example, if your survey included a question on rating satisfaction from 1 to 10, make sure all responses are recorded on this scale without discrepancies. This step minimizes the risk of misinterpretation during analysis.
Step 2: Start with Descriptive Analysis
Descriptive analysis gives you a snapshot of your survey data, helping you quickly identify overall trends and averages.
Analyze Basic Metrics
For closed-ended questions, calculate key metrics like frequencies (how often each response was selected), averages, and percentages. This analysis provides an overview of how respondents feel about certain topics.
Use Data Visualizations
Visual tools like bar charts, pie charts, and histograms make it easier to digest information at a glance. Charts help highlight significant trends and can make insights more accessible when presenting findings to non-data professionals.
Identify High-Level Patterns
Look for patterns and outliers. For example, if you see that a large majority rates a feature as very important, that’s a strong signal. Conversely, any unexpected outliers might indicate areas needing further investigation.
Example: A bar chart showing feature preferences could reveal that 80% of respondents value “ease of use” most in your app, while only 15% value “customization options.”
Step 3: Go Deeper with Cross-Tabulation
Cross-tabulation is a method that allows you to explore relationships between variables by comparing data across different segments.
Identify Relationships Between Variables
Cross-tabulate responses to see correlations and patterns between different questions. For instance, cross-tabulating customer satisfaction with customer service ratings can reveal if high-quality service correlates with overall satisfaction.
Uncover Segment-Specific Insights
Examining how responses differ by demographic or psychographic variables can give you a clearer picture of your audience’s preferences. For example, comparing satisfaction scores across different age groups may show that younger customers value certain features differently than older ones.
Example: Cross-tabulating purchase intent with age group could reveal that respondents aged 18-24 are more likely to express high purchase intent for eco-friendly products, providing a targeted opportunity.
Step 4: Analyze Open-Ended Responses
Open-ended responses provide rich qualitative data that can offer deeper insights into consumer attitudes, motivations, and expectations. However, they require a more nuanced approach to analysis.
Code and Categorize Responses
Coding involves categorizing similar responses into themes or topics. This can be done manually or with the help of text analysis tools. Coding makes it easier to quantify open-ended responses and identify recurring themes or opinions.
Text Analysis and Sentiment Analysis
Use text analysis to spot commonly used words and phrases, and apply sentiment analysis to gauge the tone of responses. This approach can help you understand the general sentiment around a product or feature.
Example: If several respondents mention that your website is “confusing,” you can code this feedback under the theme of “usability issues” and prioritize website improvements
Step 5: Use Statistical Testing for Deeper Insights
Statistical testing can confirm whether patterns you observe are meaningful or just random noise.
Hypothesis Testing
If you have assumptions based on initial observations, use hypothesis testing to validate these. For instance, you might hypothesize that a new feature has led to increased customer satisfaction and then conduct tests to see if satisfaction scores differ significantly before and after implementing the feature.
Confidence Intervals and Significance
Confidence intervals allow you to determine how certain you can be about survey results. For instance, a 95% confidence interval indicates a high level of certainty, while significance testing ensures that observed differences (e.g., higher satisfaction among a certain group) are statistically meaningful.
Example: Conduct a t-test to assess if customer satisfaction ratings significantly differ between users in two geographic regions. This could indicate regional preferences or expectations.
Step 6: Apply Advanced Analytics (If Needed)
For more in-depth insights, consider advanced analytics techniques that provide a multi-dimensional view of your data.
Segmented Cluster Analysis
Cluster analysis groups respondents into segments based on similarities in their responses, helping you identify distinct audience types. In marketing, cluster analysis can reveal target segments with unique preferences or pain points, informing targeted strategies.
Regression Analysis
Regression analysis identifies which factors most impact customer satisfaction, loyalty, or purchase intent. For instance, you can use regression to see how satisfaction scores are influenced by product features, customer service quality, or price.
Example: A regression analysis might show that satisfaction scores are most strongly influenced by customer service response time and product usability, pointing to areas for improvement.
Step 7: Synthesize Insights and Form Conclusions
Once you’ve completed your analysis, it’s time to synthesize findings and translate them into actionable insights.
Summarize Key Findings
Highlight the most critical insights that align with your business goals. Rather than overwhelming stakeholders with all data points, focus on the metrics that will have the biggest impact on decision-making.
Develop Actionable Recommendations
Use insights to inform strategic recommendations. For example, if survey results reveal that customers value a specific product feature, you might prioritize that feature in marketing materials or product updates.
Example: If data shows that convenience and ease of use are top priorities for your customers, you might recommend simplifying the product onboarding process to improve user experience and satisfaction.
Step 8: Present Your Survey Results
Presenting survey results effectively is as important as the analysis itself, especially when communicating with stakeholders who may not be familiar with data interpretation.
Choose the Right Visualizations
Select visualizations that make complex data clear and intuitive. For example, use heat maps for satisfaction scores across different customer segments or infographics for a high-level summary of findings.
Tailor Insights for Stakeholders
Frame your findings based on the interests and needs of each department. For example, the marketing team might need insights on brand perception, while product development may focus on feature satisfaction.
Create a Clear Summary
Provide an executive summary that includes key takeaways and actionable points, making it easy for stakeholders to understand the implications and recommendations.
Example: A report could include an infographic summarizing key customer preferences, followed by detailed segment insights and specific actions for each department.
Conclusion and Next Steps
Mastering survey analysis can significantly enhance your ability to understand customer needs and make informed business decisions. By following these steps, you’ll be equipped to analyze survey data like a pro, translating raw data into insights that drive strategy and improve customer satisfaction.
When running your next survey, remember that each step—cleaning data, performing descriptive and advanced analysis, and presenting findings—is essential to delivering meaningful, actionable insights. By treating survey analysis as both a science and an art, you can unlock the full potential of consumer insights and ensure your decisions are informed by accurate, in-depth data.
Call to Action
Ready to turn survey data into powerful insights? Start by applying these steps to your next consumer survey, or consider leveraging data collection, analysis, and visualization tools like SightX to streamline the process. With SightX, you can efficiently collect, analyze, and visualize survey data and uncover actionable insights that guide impactful, customer-centric strategies.
By following this structured approach, marketers and insights professionals can approach survey data analysis confidently, knowing that their decisions are grounded in a thorough understanding of consumer needs and preferences.