Understanding Regression Analysis: A Comprehensive Guide to Unlocking Insights

Regression analysis offers a robust statistical method to uncover relationships, predict outcomes, and drive decision-making. At its core is the regression model, a powerful tool that enables data professionals to analyze patterns and trends. Whether you're a business professional, a researcher, or a data enthusiast, understanding how regression models work, can empower you to make data-driven choices with confidence. This guide covers the fundamentals of regression analysis, its importance, how it works, the types of regression models, common pitfalls, and tools you can use.

What is Regression Analysis?

Regression analysis is a statistical technique used to examine the relationship between variables. At its core, it seeks to determine how one or more independent variables influence a dependent variable. By modeling these relationships, regression analysis helps predict outcomes, understand causation, and identify trends.

For instance, a company might use regression analysis to determine how advertising spend (independent variable) impacts sales revenue (dependent variable). Similarly, researchers could explore how age and exercise frequency affect blood pressure levels.

Why is Regression Analysis Important?

Unveiling Relationships

Regression analysis goes beyond simple correlations. It helps uncover the strength and direction of relationships, revealing insights that are crucial for making informed decisions.

Predictive Power

A major strength of regression analysis is its ability to forecast outcomes. Businesses can predict future sales, researchers can anticipate trends, and policymakers can assess the impact of new initiatives.

Optimization and Decision-Making

By quantifying relationships, regression analysis enables optimization. Marketers, for example, can allocate budgets more effectively by understanding which channels deliver the best ROI.

How to Use Regression Analysis 

The process involves:

  • Identifying your dependent variable (what you want to predict or understand).
  • Selecting independent variables (potential predictors or influencers).
  • Collecting and cleaning data.
  • Using statistical software or tools to build and evaluate the regression model.
  • Interpreting the results to drive actionable insights.

How Does Regression Analysis Work?

Dependent Variables

The dependent variable is the outcome you're trying to understand or predict. For example, sales figures, customer satisfaction scores, or disease incidence rates might be dependent variables.

Independent Variables

Independent variables are the factors believed to influence the dependent variable. They could include price, marketing spend, customer demographics, or environmental factors.

Explore Related Content: Discover our deep dive into the concepts of independent and dependent variables.

Additional Variables

Sometimes, regression models involve additional variables that enhance understanding:

  • Explanatory Variables: These clarify why relationships exist.
  • Predictor Variables: Focused on forecasting outcomes, they refine the model’s predictive power.
  • Experimental Variables: Introduced during controlled experiments to observe their effects.
  • Subject Variables (Fixed Effects): Attributes inherent to the subjects being studied, such as gender or location, often controlled for in models to avoid bias.

How to 'Do' a Regression Analysis 

  1. Define Your Objective: Clearly state what you aim to discover or predict.

  2. Prepare the Data:
    • Collect relevant data points.
    • Handle missing values and outliers.
    • Normalize or transform data if necessary.
  3. Choose the Right Model: Decide which type of regression best fits your needs (e.g., linear, logistic).

  4.  Run the Analysis: Use statistical tools or software (e.g., SPSS, Python, R, or use automated Regression by SightX) to build the model.
  5. Evaluate Results:
    • Examine coefficients to understand variable impact.
    • Assess model fit using metrics like R-squared or AIC/BIC.

Interpret and Act: Translate findings into actionable insights for decision-making.

Types of Regression

1. Simple Linear Regression

This is the most basic form, involving one dependent variable and one independent variable. For example, a retailer might analyze how price changes affect product demand.

2. Multiple Regression

When multiple independent variables influence a single dependent variable, multiple regression is used. It’s often employed in marketing to assess the combined impact of price, advertising, and seasonality on sales.

3. Multivariate Regression

Multivariate regression extends the analysis to multiple dependent variables. For instance, a healthcare study might analyze how different treatments simultaneously impact patient recovery time and quality of life.

4. Logistic Regression

Logistic regression is used when the dependent variable is categorical (e.g., yes/no, success/failure). This is common in binary classification tasks like predicting customer churn or fraud detection.

Common Mistakes with Regression Analysis

  1. Ignoring Multicollinearity: When independent variables are highly correlated, it can skew results. Check for multicollinearity using Variance Inflation Factors (VIFs).
  2. Overfitting: A model that’s too complex may fit the training data perfectly but fail to generalize to new data. Use regularization techniques to mitigate this.
  3. Omitting Relevant Variables: Excluding important predictors can lead to biased results.
  4. Misinterpreting Correlation as Causation: Regression shows relationships, not causation. Be cautious in drawing conclusions.
  5. Neglecting Assumptions: Regression assumes linearity, homoscedasticity, and normality. Violating these can compromise model validity.

Regression Analysis Tools

Several tools are available for conducting regression analysis, ranging from statistical software to machine learning platforms:

  • R and Python: These programming languages offer powerful libraries (e.g., scikit-learn, statsmodels) for regression analysis.
  • SPSS and SAS: Popular in academia and industry for their user-friendly interfaces and robust statistical capabilities.
  • Excel: Suitable for simple regression tasks, Excel provides a good starting point for beginners.
  • SightX Enhancing Regression Analysis: SightX leverages cutting-edge technology to make regression analysis accessible, efficient, and actionable. With features like intuitive data visualization, automated insights, and seamless integration with survey tools, SightX empowers users to extract maximum value from their data.

Why SightX Stands Out

  • Simplified Workflow: No need for complex coding—our platform handles the heavy lifting.
  • Real-Time Insights: Instantly uncover patterns and relationships to drive decision-making.
  • Quality Assurance: With built-in checks for data quality and assumptions, SightX ensures reliable results.

Regression analysis is a powerful tool that transforms raw data into meaningful insights. By understanding its mechanics, selecting the right type, and avoiding common pitfalls, you can harness its full potential. Whether you're predicting market trends, optimizing campaigns, or driving innovation, regression analysis is your key to informed decisions!


Estimated Read Time
4 min read

Understanding Brand Recall: Why it’s Crucial for Your Business

In a crowded marketplace, where countless brands compete for attention, making a lasting impression is vital. Brand recall is a key metric that measures how well your target audience remembers your brand, which can have a profound impact on your success. But what exactly is brand recall, why is it important, and how can you measure and improve it?

This blog dives deep into the concept of brand recall, explores its importance, examines the factors that influence it, and provides actionable strategies to measure and enhance it effectively.

What is Brand Recall?

Brand recall refers to a consumer’s ability to spontaneously remember a brand when prompted with a product category, need, or situation. It’s a critical component of brand awareness, indicating the strength of the connection between your brand and the consumer's mind.

Aided vs. Unaided Brand Recall

Brand recall can be categorized into two types:

  1. Aided recall: Consumers are provided with cues or a list of brands and asked if they recognize any of them. For example: “Which of these brands have you seen in the past week?”
  2. Unaided recall: Consumers are prompted with a general category or situation and asked to name brands that come to mind without any cues. For example: “When you think of athletic footwear, which brands come to mind?”

Unaided recall is considered a stronger indicator of brand awareness, as it shows the brand's ability to stand out in a consumer’s memory without assistance.

Why is Brand Recall Important?

Brand recall is more than just a measure of awareness—it’s a fundamental aspect of a brand’s success in the marketplace. Here’s why it matters:

1. Drive Sales

A strong brand recall ensures your brand is top-of-mind when consumers are ready to make a purchase. When customers instantly think of your brand in a relevant context, they are more likely to choose it over competitors.

2. Outpace Competition

In highly competitive markets, brand recall is a differentiator. If consumers remember your brand before others, it can give you a decisive edge in winning their business.

3. Boost Brand Equity

Brand recall contributes to brand equity—the perceived value of your brand. A memorable brand builds trust and loyalty, which translates into higher customer lifetime value and pricing power.

4. Enhance Marketing ROI

Brands with strong recall benefit more from their marketing efforts. A recognizable brand amplifies the effectiveness of campaigns, as consumers are already familiar with and receptive to the message.

Tying Brand Recall to Branding Strategy

Brand recall is deeply intertwined with branding strategy. It reflects how well your branding efforts—such as your logo, tagline, colors, and messaging—resonate with your audience. High brand recall indicates that your strategy is successful in creating a memorable and distinct identity.

In essence, improving brand recall should be a cornerstone of any branding strategy, ensuring your brand remains visible and relevant in the minds of consumers.

What Factors Affect Brand Recall

Several factors influence a consumer’s ability to recall your brand. Understanding these elements can help you design strategies to enhance recall:

1. Brand Exposure

Frequent exposure to a brand through advertising, promotions, and social media increases the likelihood of recall. The more often consumers see your brand, the stronger the mental association becomes.

2. Emotional Connection

Brands that evoke emotions—whether through storytelling, experiences, or values—are more likely to be remembered. Emotional connections create deeper and longer-lasting impressions.

3. Distinctiveness

Unique elements such as logos, jingles, colors, and taglines make a brand stand out. For instance, McDonald’s golden arches or Nike’s swoosh logo are instantly recognizable worldwide.

4. Relevance

A brand that consistently aligns with a consumer's needs, preferences, or aspirations is more likely to be top-of-mind. Relevance ensures the brand is seen as a natural choice in its category.

5. Consistency

Consistency in branding elements—such as messaging, visuals, and tone—reinforces recognition. A consistent brand image across all touchpoints strengthens recall.

How to Measure Brand Recall  

Measuring brand recall involves assessing how well your target audience remembers your brand. This can be done through surveys, interviews, or observational studies.

What is a Brand Recall Survey?

A brand recall survey is a research tool used to measure how well consumers remember your brand, either unaided or aided. These surveys typically include questions aligned to the aforementioned brand recall categories of aided vs. unaided:

  1. Unaided Recall Questions:
    • “What brands come to mind when you think of smartphones?”
    • “Which brands do you associate with refreshing beverages?”
  2. Aided Recall Questions:
    • “Have you heard of [Brand Name]?”
    • “Which of these brands have you seen in the past month?”

Brand recall surveys can be conducted online, via telephone, or in person, and they often include demographic and behavioral questions to segment results effectively.

Steps to Conduct a Brand Recall Survey

  1. Define objectives: Determine what you want to learn, such as general recall, category-specific recall, or comparisons with competitors.
  2. Identify target audience: Choose a representative sample of your audience to ensure results are meaningful.
  3. Design the survey: Use a mix of unaided and aided recall questions to assess recall comprehensively.
  4. Collect data: Distribute the survey using tools like SightX for efficient and accurate data collection.
  5. Analyze results: Look for patterns and insights, such as which demographics recall your brand most and which competitors are frequently mentioned.

How to Improve Brand Recall  

Once you’ve measured your brand recall, the next step is to implement strategies to enhance it:

1. Increase Visibility

Use consistent and frequent advertising to ensure your brand remains visible. Explore a mix of digital, social media, and traditional channels to maximize reach.

2. Create Emotional Resonance

Leverage storytelling and brand values to connect with your audience on an emotional level. Memorable campaigns often evoke strong feelings, whether it’s joy, nostalgia, or inspiration.

3. Optimize Branding Elements

Make sure your logo, tagline, and other brand identifiers are distinctive and easy to recognize.

4. Engage on Social Media

Social media platforms provide an excellent opportunity to interact with your audience and reinforce brand associations. Consistent posting and engagement can keep your brand top-of-mind.

5. Focus on Quality and Customer Experience

Delivering exceptional products and services creates positive experiences that consumers are more likely to remember.

Why Use SightX for Brand Recall Management

SightX offers a cutting-edge solution for measuring and improving brand recall. Here’s why it’s the ideal choice:

1. Advanced Survey Tools

SightX provides customizable survey templates, making it easy to create professional brand recall surveys tailored to your objectives.

2. AI-Powered Insights

With AI-driven analytics, SightX helps you uncover deeper insights into your brand recall performance and identify actionable strategies to improve it.

3. Real-Time Data Collection

Monitor responses in real-time, enabling you to adjust and optimize your survey campaigns as needed.

4. Competitive Benchmarking

SightX allows you to measure your brand recall against competitors, providing a clear picture of where you stand in the market.

5. User-Friendly Platform

Whether you’re an experienced researcher or a beginner, SightX’s intuitive interface makes it easy to design, distribute, and analyze surveys.

Brand recall is a critical indicator of a brand’s strength and relevance in the marketplace. By understanding its importance, the factors that influence it, and how to measure it effectively, businesses can develop strategies to stay top-of-mind with their audience.

Whether you’re aiming to boost sales, outpace competitors, or enhance your brand equity, improving brand recall should be at the core of your branding efforts. With tools like SightX, measuring and optimizing brand recall has never been easier.

Related articles:


Estimated Read Time
5 min read

Survey Essentials: A Practical Guide to Mastering Surveys

Surveys are an essential part of data collection, helping businesses, researchers, and organizations gather valuable insights from their target audiences. Whether you’re trying to understand consumer preferences, measure employee satisfaction, or gather feedback on a new product, surveys offer a reliable and efficient way to collect the information you need.

In this comprehensive guide, we’ll cover the fundamentals of surveys: what they are, the various types, their benefits, how to use a survey tool effectively, and why SightX is the ideal partner for all your survey needs.

What Is a Survey?

A survey is a method of gathering information from a specific group of people, usually through a set of structured questions. Surveys are designed to collect data on attitudes, opinions, behaviors, or characteristics and can be used for a wide variety of purposes, including:

  • Market research: Understanding consumer needs and preferences.
  • Academic research: Investigating hypotheses or exploring new areas of study.
  • Employee feedback: Measuring job satisfaction or workplace culture.
  • Customer feedback: Gauging satisfaction with products or services.

Surveys can vary in length and complexity, ranging from quick polls with a few questions to in-depth questionnaires designed for extensive analysis.

Types of Surveys

The method you choose to conduct your survey plays a crucial role in its success. Each survey type has unique advantages and disadvantages, and the choice often depends on the target audience, budget, and desired outcome.

  WHAT IT IS ADVANTAGES DISADVANTAGES BEST FOR
FACE-TO-FACE In this traditional method, a researcher or interviewer meets respondents in person to ask survey questions.
  • High response rates due to personal interaction.
  • Opportunity for interviewers to clarify questions or probe deeper for more detailed responses.
  • Suitable for complex surveys requiring explanation.
  • Expensive and time-consuming.
  • Limited geographic reach.
  • Potential for interviewer bias.
In-depth qualitative studies or when targeting hard-to-reach populations.
TELEPHONE Conducted over the phone, this method involves interviewers asking respondents a set of predetermined questions.
  • Faster and more cost-effective than face-to-face surveys.
  • Can reach geographically dispersed respondents.
  • Allows real-time clarification of questions.
  • Declining response rates due to call screening and mobile phone usage.
  • Limited survey length due to respondent patience.
Quick quantitative studies or when direct interaction is required without in-person meetings.
PAPER-AND-PENCIL This traditional approach involves respondents completing printed questionnaires.
  • No need for internet or electronic devices.
  • Familiar and easy for many people, especially older demographics.
  • Can be distributed widely through mail or in-person.
  • Slow response times.
  • Manual data entry increases the risk of errors and labor costs.
  • Difficult to track progress or send reminders.
Surveys in rural areas or with populations less comfortable with technology.
ONLINE Respondents complete the survey online using a computer, tablet, or smartphone.
  • Cost-effective and scalable.
  • Automated data collection and analysis.
  • Allows multimedia elements like images and videos.
  • Easy to track progress and send reminders to boost response rates.
  • May exclude populations with limited internet access.
  • Potential for lower response rates if poorly designed.
Mass surveys, market research, and any scenario requiring quick data collection and analysis.

Benefits of Surveys

Surveys offer a host of benefits that make them an indispensable tool for data collection:

  1. Scalability: Surveys can be distributed to large audiences, enabling businesses to gather data from diverse groups quickly and efficiently.
  2. Cost-effectiveness: Compared to focus groups or in-depth interviews, surveys are relatively inexpensive.
  3. Customizability: Surveys can be tailored to specific research objectives, with question types and formats suited to the data being collected.
  4. Quantifiable results: Surveys provide structured data that can be analyzed statistically to generate actionable insights.
  5. Flexibility: Surveys can address a wide range of topics and are adaptable to different industries and purposes.

Why Use a Survey Tool?

Survey tools streamline the process of designing, distributing, and analyzing surveys, offering significant advantages over manual methods. Here’s why they are indispensable:

  • Ease of use: Modern survey tools provide intuitive interfaces for creating surveys, with drag-and-drop features and customizable templates that require no technical expertise.
  • Advanced question logic: Features like skip logic and branching allow for dynamic surveys that adapt based on respondents’ answers, ensuring a more personalized experience.
  • Automated data collection and analysis: Survey tools automatically capture responses and often include built-in analytics, saving time and reducing the risk of errors associated with manual data entry.
  • Distribution flexibility: Survey tools enable multi-channel distribution, including email, social media, websites, and SMS, helping you reach your target audience wherever they are.
  • Real-time feedback: With survey tools, you can monitor responses as they come in and make adjustments to improve response rates or address issues.
  • Scalability: Survey tools can handle large volumes of responses, making them suitable for organizations of all sizes.

How to Use a Survey Tool

Getting started with a survey tool is easy, but maximizing its potential requires a structured approach. Follow these steps to create and execute a successful survey:

Step 1: Define Your Objective

Clearly articulate the purpose of your survey. Are you gathering feedback on a product, measuring customer satisfaction, or conducting academic research?

Step 2: Identify Your Target Audience

Determine who you need to survey and how you’ll reach them. A well-defined audience ensures relevant and actionable insights.

Step 3: Design Your Survey

  • Choose the Right Questions: Use a mix of open-ended, closed-ended, and scaled questions to gather comprehensive data.
  • Keep It Short: Respect respondents’ time by focusing on essential questions.
  • Use Logic and Flow: Ensure questions follow a logical progression and avoid redundancy.

Step 4: Distribute the Survey

Leverage the distribution capabilities of your survey tool to send surveys via email, embed them on websites, or share them on social media.

Step 5: Monitor and Optimize

Track response rates in real-time and use the tool’s features to send reminders or adjust questions as needed.

Step 6: Analyze the Results

Use built-in analytics to interpret the data, identifying trends, patterns, and actionable insights.

Why Use SightX?

When it comes to survey tools, SightX stands out as a leader in providing innovative, user-friendly, and comprehensive solutions for all your survey needs. Here’s why SightX is the ideal choice:

1. End-to-End Survey Platform

SightX offers a fully integrated platform for creating, distributing, and analyzing surveys, eliminating the need for multiple tools.

2. Advanced Analytics

Powered by AI, SightX provides in-depth data analysis capabilities, helping you uncover insights that might be missed with traditional survey tools.

3. Customizable Templates

Whether you’re conducting market research or academic studies, SightX offers templates designed to meet specific needs, saving you time and effort.

4. User-Friendly Interface

With an intuitive design, SightX makes it easy for beginners and experts alike to create professional-grade surveys.

5. Robust Logic Features

From advanced branching to conditional logic, SightX enables you to create dynamic surveys that adapt to respondent input for a better experience.

6. Multi-Channel Distribution

Reach your audience wherever they are with SightX’s versatile distribution options, including email, SMS, and embedded links.

7. Dedicated Support

SightX provides exceptional customer support, ensuring you get the help you need to execute your survey projects successfully.

Surveys are a powerful tool for gathering insights, enabling organizations to make data-driven decisions with confidence. By understanding the different types of surveys and their benefits, you can choose the right approach for your needs.

Survey tools like SightX simplify the process, offering advanced features and analytics to take your surveys to the next level. With its end-to-end capabilities and user-friendly design, SightX ensures that every step of your survey journey is efficient, insightful, and impactful.

Ready to unlock the full potential of surveys? Start your journey with SightX today and experience the difference firsthand!

Related articles


Estimated Read Time
5 min read

2025 Consumer Research Trends

The consumer research industry is rapidly transforming, driven by technological advancements, a heightened focus on data privacy, and an increased demand for personalization. In 2025, brands that want to stay competitive will need to align their strategies with the latest developments in consumer insights. This blog highlights the top 10 trends set to define consumer research, complete with insights, data, and real-world examples.

1. Real-Time Data Collection and Analysis 

In today’s fast-moving market, the ability to analyze data as soon as it’s collected offers significant competitive advantages. Real-time analytics enable companies to respond to shifts in consumer behavior and trends as they happen. From crisis management to campaign optimization, this immediate data access supports smarter, more adaptive decision-making.

Statistics 

According to Deloitte, companies using real-time data saw a 70% improvement in response time for adapting to consumer needs.

Why This matters

In 2025, agility is key. Real-time data enables brands to react instantly, allowing for rapid optimization of marketing and product strategies. Companies that leverage real-time data are better equipped to meet consumer expectations and mitigate risks.

2. Multi-Modal Research Approaches

To achieve a comprehensive understanding of consumer behavior, companies are increasingly turning to multi-modal research approaches that blend qualitative, quantitative, and behavioral data. By cross-referencing different data types, businesses can derive more nuanced insights.

Statistics 

GreenBook reports that 62% of market researchers in 2024 implemented multi-modal research methods, showing an increase from 47% in 2022.

Why This matters

In a world where consumer behavior is complex and multi-faceted, relying on a single data source can lead to incomplete conclusions. Multi-modal approaches help researchers uncover deeper insights and better predict consumer trends.

3. Focus on Data Privacy and Trust

With data privacy regulations expanding globally, companies are focusing on transparent and ethical data practices. Consumer trust is now critical for brand loyalty, and brands that fail to prioritize privacy can face significant reputational damage.

Statistics 

 A PwC survey found that 86% of consumers now consider data privacy a major concern. Companies are adopting privacy-first research practices, such as consent-based data collection and anonymizing consumer data, to ensure compliance with regulations like GDPR and CCPA.

Why This matters

Consumers are increasingly aware of and sensitive to how their data is used. Brands that prioritize transparency and privacy will build stronger consumer trust and reduce the risk of regulatory fines or backlash.

4. Integration of Behavioral and Attitudinal Data

Combining behavioral (what consumers do) and attitudinal data (why they do it) allows companies to understand both the actions and motivations behind consumer choices. This hybrid data approach provides a more holistic view of the customer journey, from awareness to purchase.

Statistics 

78% of market researchers report that blending behavioral and attitudinal data improves their ability to predict future behavior (Forbes Insights, 2023).

Why This matters

Integrating both data types allows brands to identify consumer motivations and preferences, leading to better segmentation and targeted marketing strategies.

5. Predictive Analytics with AI and Machine Learning

AI-powered predictive analytics allow companies to go beyond understanding past behaviors to forecasting future actions. Machine learning models can identify patterns that are too complex for human analysis, helping brands stay proactive in addressing consumer needs.

Statistics 

The predictive analytics market is expected to reach $22 billion by 2025, as more companies invest in machine learning to enhance forecasting accuracy (Grand View Research, 2024).

Why This matters

Predictive analytics can inform smarter business decisions and empower brands to create personalized experiences based on likely future actions, enhancing customer satisfaction and loyalty.

6. Decentralization of Research Teams

The rise of remote work has led to decentralized research models, with companies now operating global research teams that provide localized consumer insights. This approach enables brands to tap into diverse perspectives and better understand regional differences.

Statistics 

A 2024 McKinsey report indicates that decentralized teams are 23% more efficient in handling global market research than centralized ones.

Why This matters

Decentralized teams offer companies greater flexibility and efficiency, especially when conducting research in multiple markets. This approach also enables businesses to localize insights more effectively, leading to more relevant marketing strategies.

7. Voice and Conversational AI for Data Collection

Voice-activated and conversational AI has gained popularity as a tool for collecting consumer insights, with voice-activated surveys making the process more conversational and engaging. This trend not only simplifies data collection but also appeals to younger demographics who are accustomed to voice technology through virtual assistants.

Statistics 

Markets and Markets estimates that voice technology in consumer research will grow by 40% in adoption by 2025, reaching a market size of $6 billion.Platforms that integrate voice-activated surveys into smart home devices allow consumers to respond to questions in a natural, conversational manner. This technology also enables real-time feedback on consumer experiences, such as in hospitality or retail environments.

Why This matters

Voice and conversational AI streamline data collection, making it more accessible and reducing friction for respondents. This technology can also uncover nuanced insights by analyzing tone and sentiment, providing brands with a deeper understanding of consumer emotions.

8. Decentralized Data Storage and Blockchain

Blockchain technology is gaining traction in consumer research as a secure and transparent data storage method. By decentralizing data storage, brands can protect consumer information from breaches and offer more control over data ownership, addressing growing privacy concerns.

Statistics 

The blockchain market for data privacy is anticipated to grow to $8 billion by 2026 (Allied Market Research, 2023). For example, some brands use blockchain to create transparent consumer data logs, allowing consumers to access a record of how their data is used. This approach builds trust, as consumers can verify that their information is stored and accessed ethically.

Why This matters

Blockchain not only enhances security but also provides transparency, which can increase consumer trust. By offering decentralized storage, brands demonstrate a commitment to privacy and responsible data handling, which is increasingly important to consumers.

9. Hybrid Data Sources

The blending of first-party, third-party, and zero-party data (information explicitly shared by consumers) enables companies to create more detailed consumer profiles. By integrating data from multiple sources, brands can fill knowledge gaps and gain a richer understanding of their target audience.

Statistics 

According to eMarketer, 65% of companies are now combining data sources to enhance consumer insights and improve targeting accuracy. For example, Spotify uses first-party data from user interactions and complements it with third-party audience insights to personalize playlists, ads, and recommendations, creating a highly customized user experience.

Why This matters

The integration of hybrid data sources allows for better-informed decisions, especially as consumer behaviors shift. It empowers brands to leverage the richness of diverse data types, which translates to more precise marketing, personalized content, and relevant product recommendations.

10. Visual Insights and Eye-Tracking Analysis

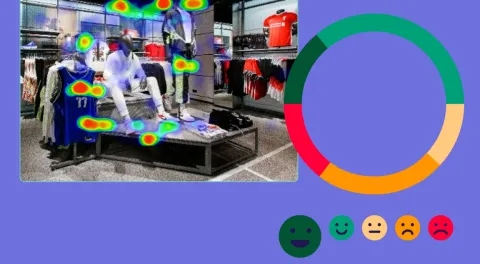
Eye-tracking analysis has become a popular tool for understanding visual attention. By analyzing where consumers look, how long they focus on specific elements, and their gaze path, brands can optimize product designs, website layouts, and ad placements for maximum impact.

Statistics 

The eye-tracking market is projected to grow to $4 billion by 2025 (Grand View Research, 2024), driven by its application in advertising and UX testing. Example:  Amazon uses eye-tracking studies to improve the layout of product detail pages, ensuring that essential information like price and customer reviews are in areas where users are most likely to look first.

Why This matters

Visual insights enable brands to make data-driven design choices, ensuring that key information captures consumer attention. Eye-tracking technology is particularly useful in e-commerce and digital advertising, where the effectiveness of visual elements can significantly impact conversions.

+ 1 (A bonus!). Enhanced Data Visualization and Insights Dashboards

Data visualization tools are essential for making complex insights accessible and actionable. By presenting data in an intuitive format, such as dashboards, companies can enhance team comprehension, making insights easier to interpret and implement.

Statistics 

Forrester reports that companies using advanced data visualization tools see a 75% improvement in data comprehension across departments.

Why This matters

Enhanced visualization and interactive dashboards allow companies to democratize data across teams, making insights easier to communicate and act upon. This trend supports data-driven decision-making at all organizational levels.

An overview of the most prominent consumer research trends of 2025 underscore a shift toward personalization, privacy, and automated technological integration. By leveraging these trends, brands can gain richer insights into consumer behavior, build trust, and improve customer experiences. Staying aligned with these trends will be crucial for brands looking to maintain a competitive edge in an evolving market landscape.


Estimated Read Time
6 min read

The Role of the t-Test in Survey Research

Statistical analysis is a critical part of conducting research across disciplines, from business and psychology to medicine and engineering. Among the many tools at a researcher’s disposal, the t-test is one of the most widely used and fundamental. It allows us to assess whether differences between groups or samples are statistically significant—an important step in hypothesis testing.

This blog dives deep into the theory and application of the t-test including its types, when to use it, and how to run one. By the end, you'll have a clear understanding of this essential statistical tool.

What Is a t-Test?

A t-test is a statistical method used to compare the means of one or more groups to determine if the observed differences are significant or if they could have occurred by chance.

The t-test is based on the t-distribution, a probability distribution that is symmetric and bell-shaped, similar to the normal distribution but with heavier tails. The t-distribution is particularly useful when working with small sample sizes, which is why the t-test is favored in studies with limited data points.

The formula for the t-test varies depending on the type, but the general concept involves comparing the observed differences in means to the variability (or standard deviation) in the data, relative to the sample size.

Key Assumptions of the t-Test

Before running a t-test, it’s important to ensure that your data meets the following assumptions:

  1. Normality: The data should be approximately normally distributed.
  2. Independence: Observations must be independent of each other.
  3. Homogeneity of variance: Variance within groups should be similar for two-sample t-tests.

Types of t-Test

There are several types of t-tests, each suited to specific research questions and data structures.

One-sample t-Test

WHAT IS IT EXAMPLE USE CASE FORMULA

Compares the mean of a single group to a known value or theoretical expectation.

A company wants to determine if the average time it takes to process an order (mean = 32 minutes) differs from their target time of 30 minutes.

t=xˉ−μs/nt = \frac{\bar{x} - \mu}{s / \sqrt{n}}t=s/n​xˉ−μ​

Where:

  • xˉ\bar{x}xˉ: Sample mean
  • μ\muμ: Hypothesized population mean
  • sss: Sample standard deviation
  • n: Sample size

Two-sample t-Test

WHAT IS IT EXAMPLE USE CASE FORMULA

Compares the means of two independent groups to determine if they are significantly different from each other.

Types:

  • Two-tailed test: Tests if the means of the two groups are significantly different in either direction
  • One-tailed test: Tests if the mean of one group is either significantly greater or less than the mean of the other group
A researcher wants to compare the effectiveness of two different medications on reducing blood pressure.

t=xˉ1−xˉ2s12n1+s22n2t = \frac{\bar{x}_1 - \bar{x}_2}{\sqrt{\frac{s_1^2}{n_1} + \frac{s_2^2}{n_2}}}t=n1​s12​​+n2​s22​​​xˉ1​−xˉ2​​
Where:

  • xˉ1,xˉ2\bar{x}_1, \bar{x}_2xˉ1​,xˉ2​: Means of the two groups
  • s12,s22s_1^2, s_2^2s12​,s22​: Variances of the two groups
  • n1,n2n_1, n_2n1​,n2​: Sample sizes of the two groups

Paired t-Test

WHAT IS IT EXAMPLE USE CASE FORMULA

Compares  two related samples, such as measurements taken before and after an intervention on the same subjects.

Types:

  • Two-tailed test: Tests for any significant difference between the two time points, regardless of direction.
  • One-tailed test: Tests if there is a significant increase or decrease in values between the two time points.
A gym tracks the weight of members before and after a 12-week fitness program to evaluate its effectiveness.

t=dˉsd/nt = \frac{\bar{d}}{s_d / \sqrt{n}}t=sd​/n​dˉ​
Where:

    • dˉ\bar{d}dˉ: Mean of the differences between pairs
    • sds_dsd​: Standard deviation of the differences
    • n: Number of pairs

When Should You Use a t-Test?

A t-test is appropriate when you need to determine if a difference in means is statistically significant. Here are common scenarios:

  1. Testing a hypothesis: To determine whether a sample mean differs from a known population mean (one-sample t-test).
  2. Comparing groups: To test whether two independent groups differ significantly on a specific measure (two-sample t-test).
  3. Evaluating change: To assess the impact of an intervention or change over time in the same group (paired t-test).
  4. Small sample sizes: When the sample size is small, making other tests (like the z-test) less suitable.

How to Run a t-Test?

Conducting a t-test involves several steps, from setting up the hypothesis to interpreting the results. Here’s a step-by-step guide:

Step 1: Define Your Hypotheses

  • Null Hypothesis (H0H_0H0​): Assumes no difference between groups or that the observed difference is due to chance.
  • Alternative Hypothesis (HaH_aHa​): Suggests a significant difference exists.

For example:

  • H0H_0H0​: The mean blood pressure reduction is the same for both medications.
  • HaH_aHa​: The mean blood pressure reduction differs between the medications.

Step 2: Choose the Right t-Test

Select the type of t-test based on your research design:

  • One-sample t-test for comparing a sample mean to a known value.
  • Two-sample t-test for comparing independent groups.
  • Paired t-test for analyzing related or repeated measures.

Step 3: Calculate the Test Statistic 

Using the formulas provided earlier, compute the t-value based on your data.

If you’re not performing the calculations manually, you can use software like Excel, SPSS, R, or Python to automate the process.

Step 4: Determine the Degrees of Freedom (df)

Degrees of freedom depend on the type of t-test:

  • For a one-sample t-test: df=n−1df = n - 1df=n−1
  • For a two-sample t-test: df=n1+n2−2df = n_1 + n_2 - 2df=n1​+n2​−2
  • For a paired t-test: df=n−1df = n - 1df=n−1

Step 5: Find the Critical t-Value

Using a t-distribution table, locate the critical t-value for your degrees of freedom and significance level (commonly α=0.05\alpha = 0.05α=0.05).

Step 6: Compare and Interpret

Compare your calculated t-value to the critical t-value:

  • If ∣t∣>tcritical|t| > t_{critical}∣t∣>tcritical​, reject the null hypothesis (H0H_0H0​).
  • If ∣t∣≤tcritical|t| \leq t_{critical}∣t∣≤tcritical​, fail to reject the null hypothesis.

Step 7: Report the Results

Clearly present your findings, including:

  • The type of t-test used.
  • The t-value, degrees of freedom, and p-value.
  • Your interpretation of the results (e.g., “The intervention significantly reduced blood pressure, t(29)=2.45,p<0.05t(29) = 2.45, p < 0.05t(29)=2.45,p<0.05.”).

The t-test is an important tool for researchers seeking to compare means and assess statistical significance. Understanding its types—one-sample, two-sample, and paired—and their respective use cases ensures that you apply this method effectively to your data.

Whether you’re testing a new hypothesis, evaluating group differences, or analyzing pre-and post-intervention data, the t-test provides a robust framework for deriving meaningful insights.

By mastering the steps to run a t-test, you can confidently interpret your results, advancing your research with precision and rigor.

Estimated Read Time
5 min read

Decoding the Different Types of Conjoint Analysis

Understanding consumer preferences and predicting their buying behavior is both an art and a science. One of the most powerful tools for achieving this is Conjoint Analysis. This versatile technique provides businesses with a data-driven approach to uncover what truly matters to their customers. Whether you’re deciding on product features, pricing strategies, or market positioning, Conjoint Analysis offers actionable insights that can transform decision-making.

This blog explores the ins and outs of conjoint analysis: what it is, why it matters, when to use it, and the various types of conjoint methods available.

What is Conjoint Analysis?

Conjoint analysis is a statistical technique used in market research to determine how people value different components of a product or service. By presenting respondents with a series of choices or trade-offs, this method uncovers the relative importance of individual attributes and their impact on decision-making.

Imagine a car manufacturer trying to understand whether buyers care more about fuel efficiency, price, or brand reputation. Conjoint analysis helps quantify these preferences, enabling the manufacturer to design offerings that align with consumer priorities.

What is the Purpose of Conjoint Analysis?

At its core, conjoint analysis aims to decode the customer’s decision-making process. Businesses rely on this method to:

  1. Prioritize product features: Determine which features are non-negotiable for customers and which ones are less influential.
  2. Optimize pricing strategies: Identify price points that customers find acceptable while balancing profit margins.
  3. Improve market segmentation: Uncover variations in preferences across different customer groups to better target offerings.
  4. Enhance forecasting accuracy: Predict market share or customer adoption based on how a product aligns with their preferences.
  5. Support product development: Guide design teams in creating products tailored to market demand.

The ultimate purpose of conjoint analysis is to empower organizations to make informed, customer-centric decisions that maximize value for both the business and its customers.

What to Conduct a Conjoint Analysis?

Conjoint analysis is particularly useful in situations where decisions hinge on understanding trade-offs. You should consider it if:

  • You’re developing a new product or service: Assess the ideal combination of features to include and at what price point.
  • You’re revising an existing offering: Identify changes that would boost market appeal without alienating current customers.
  • You’re evaluating pricing sensitivity: Understand how price changes impact perceived value and purchase likelihood.
  • You’re exploring market entry: Compare how your product might perform against competitors in a new market.
  • You need to understand consumer preferences in depth: Get granular insights into how consumers rank different attributes of a product.

By providing clarity in complex scenarios, conjoint analysis acts as a strategic compass for businesses navigating competitive landscapes.

The Different Types of Conjoint Analysis

Conjoint analysis is not a one-size-fits-all method. Depending on the research objectives, budget, and complexity of the study, different types of conjoint techniques can be employed. Here’s a brief overview of the most common methods:

  WHAT IT IS WHEN TO USE ADVANTAGES CHALLENGES
MENU-BASED Focuses on products or services that involve a menu of options, where customers select multiple components independently. Industries like telecommunications (e.g., selecting internet speeds, channels, and add-ons) or quick-service restaurants (e.g., customizing meal combos).
  • Captures complex purchasing behaviors.
  • Reflects real-world decision-making by allowing multiple selections.
Requires advanced design and analysis techniques due to its complexity.
TWO-ATTRIBUTE TRADE-OFF Involves comparing two attributes at a time to evaluate trade-offs. Respondents are asked to indicate their preference between pairs of options, each varying only in two attributes. Best for early-stage research when you need to explore basic trade-offs.
  • Simple and easy to execute.
  • Highlights primary drivers of choice.
Limited in scope; doesn’t capture interactions between multiple attributes.
FULL-PROFILE Respondents evaluate complete product profiles where all attributes vary simultaneously. This method mimics real-life decision-making scenarios. To understand the overall importance of attributes when customers evaluate products holistically.
  • Provides a realistic choice context.
  • Allows for detailed analysis of attribute preferences.
Can become cognitively demanding if the number of attributes or levels is too high.
ADAPTIVE This computerized method adapts questions based on previous responses. It focuses on attributes most relevant to the respondent, streamlining the survey process. Best for studies involving a large number of attributes or when respondent time is limited.
  • Reduces survey fatigue by tailoring questions.
  • Delivers more personalized insights.
  • Requires sophisticated software and expertise.
  • May lose some comparative depth compared to other methods.
CHOICE-BASED Respondents choose from a set of product profiles rather than rating or ranking them. CBC simulates real-world purchase decisions. Ideal for understanding market share and competitive positioning.
  • Closely replicates actual decision-making behavior.
  • Excellent for pricing and market simulations.
Requires a larger sample size for robust analysis.

Choosing the Right Conjoint Analysis Method

Selecting the appropriate conjoint analysis method depends on factors such as:

  • Research objectives: Are you focused on pricing, feature prioritization, or market share?
  • Complexity of the offering: Does your product involve multiple interdependent components?
  • Budget and time: Do you need quick results, or can you invest in a more detailed study?
  • Sample size and expertise: Do you have access to enough respondents and analytical resources?

By aligning the method with your specific needs, you can extract maximum value from your conjoint analysis study.

Conjoint analysis is a game-changer for businesses seeking to decode customer preferences and craft winning strategies. From optimizing product features to determining ideal pricing, this method equips organizations with the insights needed to thrive in competitive markets.

While the variety of conjoint methods may seem overwhelming, understanding their unique applications ensures you select the best approach for your research objectives. Whether you're customizing a menu of options, simulating real-world choices, or ranking attributes, there’s a conjoint analysis method that can deliver the clarity you need.

SightX Automated Conjoint Analysis Software 

SightX also offers a best-in-class suite of easy-to-use pricing research tools that will predict and maximize your revenue, and project market share. What's better than that. 

Tap into the power of the SightX Automated Conjoint Analysis Software to optimize product features, test messaging, evaluate pricing, segment your customer base, and so much more.


Estimated Read Time
4 min read

Market Research: Who, What, Why

Market research offers invaluable insights into customer psychology, market trends, and competitive landscapes. Whether you're launching a new product, refining a service, or simply looking to stay ahead of the curve, market research equips you with the data needed to make informed decisions. This blog covers the essence of market research—what it is, why it's crucial, who to target, and the specific goals it can help achieve. Finally, we'll explore the essential questions to ask your target audience to uncover actionable insights.

What is Market Research?

Market research is the process of gathering, analyzing, and interpreting information about a market, including its potential customers, competitors, and industry trends. It involves both qualitative and quantitative methods to provide a comprehensive view of market dynamics.

At its core, market research answers fundamental questions like: 

  • Who are your customers?
  • What do they want and need?
  • How do they behave in relation to your product or service?
  • What are your competitors doing?

There are two primary types of market research:

  1. Primary research: Involves collecting new data through surveys, interviews, focus groups, or direct observations.
  2. Secondary research: Utilizes existing data from reports, studies, industry publications, or databases.

By leveraging both types, businesses can paint a detailed picture of their market environment and make strategic decisions that drive growth.

Learn more about the different types of market research here.

Why do Market Research?

Market research serves as a business's compass, guiding strategies and decisions. Here’s why it is indispensable:

Understand customer needs: Understanding what your customers want is the foundation of any successful business. Market research reveals their preferences, pain points, and unmet needs, enabling you to tailor your offerings accordingly.

Reduce risk: Launching a product or entering a new market involves significant risk. Research helps mitigate these by validating assumptions and ensuring there’s a demand for your product or service before you invest heavily.

Identify market opportunities: Through research, you can uncover gaps in the market or emerging trends that present growth opportunities. It helps you stay ahead of competitors and innovate in ways that resonate with your audience.

Refine marketing strategies: Market research provides insights into how your target audience consumes information and interacts with brands, helping you optimize your messaging, channels, and campaigns for maximum impact.

Monitor competition: By analyzing competitors’ strategies, strengths, and weaknesses, you can identify differentiators for your brand and position yourself more effectively in the market.

Identifying Your Audience for Market Research

Targeting the right audience is critical to the success of your market research. Here’s a breakdown of the groups to focus on:

  • Primary Customers: These are the end-users of your product or service. Understanding their needs, behaviors, and preferences is vital for crafting resonate offerings.
  • Secondary Customers: While not the direct users, these individuals may influence the purchasing decision. For example, in B2B scenarios, procurement officers or department heads may be the decision-makers.
  • Competitors’ Customers: Studying competitors’ customers can help identify why they chose a rival brand and what could entice them to switch to yours.
  • Market Influencers: Industry experts, analysts, or social media influencers can offer unique perspectives on market trends and customer sentiment.
  • Internal Stakeholders: Don’t overlook the insights of your employees, especially those in sales and customer service roles. They often have firsthand knowledge of customer pain points and desires.

Goals of Market Research

A well-defined objective ensures that market research is purposeful and actionable. Common goals include:

1. Customer Segmentation: Market research helps divide your audience into distinct segments based on demographics, behaviors, or needs. This allows for more targeted marketing and personalized offerings.

2. Product Development: From ideation to launch, market research informs every stage of product development, ensuring alignment with customer expectations.

3. Pricing Strategy: Understanding what your target audience is willing to pay and how competitors price their products is crucial for setting competitive yet profitable prices.

4. Market Entry: For businesses expanding into new markets, research identifies potential barriers, opportunities, and cultural considerations.

5. Brand Perception: Research uncovers how your brand is perceived in the market, revealing opportunities to improve messaging, positioning, and overall reputation.

6. Customer Satisfaction and Loyalty: Regular feedback from customers helps measure satisfaction levels, pinpoint areas for improvement, and build long-term loyalty.

Questions to Ask Your Target Audience 

Asking the right questions is the heart of effective market research. Tailor these questions to suit your research goals:

Understanding demographics

  • What is your age, gender, and location?
  • What is your occupation and income level?
  • Can you describe your family or household structure?

Exploring Needs and Pain Points

  • What challenges or problems do you face in [specific area]?
  • How do you currently address these challenges?
  • What frustrates you about existing solutions?


    Evaluating Buying Behavior 

  • What factors influence your purchasing decisions (e.g., price, quality, brand)?
  • Where do you typically research or shop for [product/service]?
  • How frequently do you purchase [product/service]?

Assessing Product or Service Interest 

  • What features are most important to you in [product/service]?
  • Would you use [specific feature]? Why or why not?
  • How much would you be willing to pay for [product/service]?

    Understanding Brand Perception

  • Have you heard of our brand? If so, what comes to mind?
  • How does our brand compare to competitors?
  • What would make you more likely to choose our brand?

Identifying Communication Preferences

  • Which channels do you prefer for receiving information (e.g. social media, email)?
  • What type of content do you find most engaging or helpful?
  • How often would you like to hear from a brand like ours? 

Exploring Trends and Innovations

  • What emerging trends are you excited about in [industry]?
  • How open are you to trying new products or technologies?
  • What would convince you to adopt a new solution?

Evaluating Satisfaction and Loyalty

  • How satisfied are you with [current product/ service]?
  • What would make your experience better?
  • Would you recommend [brand/ product] to others? Why or why not? 

By understanding what it is, why it matters, and who to target, businesses can unlock insights that drive growth, innovation, and customer satisfaction. Setting clear goals and asking the right questions ensures your research efforts are impactful, delivering a competitive edge in today’s fast-paced market.

Investing in market research is not just a strategic choice—it's a necessity for businesses striving to thrive in an ever-evolving landscape. Whether you're a startup looking to break into the market or an established brand seeking to stay ahead, the insights gained from thorough market research will always be your strongest ally.

Ready to transform your business with data-driven insights? Start your market research journey today!


Estimated Read Time
4 min read

Happy Birthday, Ada!

Celebrating one year with Ada: SightX's generative AI consultant

One year ago, we introduced Ada, SightX’s generative AI consultant, a transformative tool that accelerates the research process starting with survey development all the way to actionable insights and recommendations. Built to be more than a tool, Ada brings AI-driven insights with the sophistication of a human consultant. Today, we’re celebrating Ada's journey over the past year—reflecting on her impact, sharing stories from clients, and looking forward to what lies ahead.

The Vision Behind Ada: Empowering Businesses with Generative AI

Ada’s creation was aligned with SightX’s larger vision to make insights faster, smarter, and more intuitive. Leveraging cutting-edge generative AI, Ada was designed to engage users in a conversational, human-like manner, guiding them from raw data to deep insights. Our goal: to empower decision-makers at every level to unlock the full potential of their data, make confident choices, and stay ahead in competitive markets.

Powerful Ways Ada is Transforming Consumer Research

Since its launch, Ada has excelled at the intersection of AI-driven precision and research complexity. Users are discovering how Ada can transform their research, uncovering valuable and -more importantly- actionable insights.

  1. Guided Support and Knowledge Sharing: Receive expert advice on your study and access best practices to dramatically reduce time-to-launch.
  2. A.I.-Powered Automated Analysis: Process extensive data sets with precision. Gain actionable insights through comprehensive quantitative and qualitative reporting, empowering teams of any size to make confident, data-driven decisions.
  3. Open-End Analysis: Revolutionize the way you handle qualitative data. Ada interprets and categorizes open-ended responses in minutes, delivering actionable insights with unparalleled speed and accuracy.
  4. Executive Summaries: Save time (read: days of work) and effort with Ada’s one-click summaries. Quickly generate concise project summaries that highlight key insights and trends, uncovering hidden opportunities.  

What's Next for Ada?

SightX will continue to pioneer the integration of artificial intelligence into the fabric of research methodologies by offering:

  • Deeper integrations with popular data sources.
  • Advanced natural language processing for greater contextual understanding.
  • Enhanced customization for complex projects.
  • Even faster performance to meet evolving client needs.

Thank You to Our Clients and Partners

To everyone who has been part of Ada's journey, we’re deeply grateful. Your insights, feedback, and success stories have been vital in shaping Ada's evolution. Here’s to Ada’s first anniversary and to an even more transformative year ahead!

Thank you for trusting SightX, and thank you for welcoming Ada as part of your team. Here’s to pushing boundaries and creating a future where AI-powered insights drive business growth and innovation!


Estimated Read Time
2 min read

Three Levels of Pain Points in the Customer Experience

Understanding customer pain points is critical for marketers and insights professionals to build and scale successful brands. Customers today expect seamless interactions, personalized service, and brands that genuinely care about their needs. When these expectations aren’t met, it creates pain points—frustrations that impact customer satisfaction, loyalty, and ultimately, a brand’s reputation. By identifying and addressing pain points at different levels, brands can cultivate stronger connections, encourage loyalty, and foster brand advocacy.

In this guide, we’ll examine three levels of pain points in customer experience, ranging from surface-level frustrations to deep-seated issues that can drive customers away. For each level, we’ll discuss how to identify and address these challenges effectively. Let’s dive into the journey of understanding and managing customer pain points like a pro.

Level 1: Surface-Level Pain Points (Transactional Issues)

Surface-level pain points are transactional issues that may irritate customers but typically don’t harm long-term loyalty unless they accumulate. These pain points are often logistical or minor functional problems that prevent customers from completing tasks smoothly. While they may not always drive customers away, addressing them promptly can enhance the overall experience and build goodwill.

Examples of Surface-Level Pain Points

  • Slow website load times: A website that loads slowly or crashes frequently can frustrate users and lead to abandoned carts or missed conversions.
  • Limited payment options: Customers expect flexibility. If a brand only accepts limited payment methods, customers might decide not to complete a purchase.
  • Inconvenient return policies: An overly complicated return process can discourage customers from making a purchase, especially if they have doubts about the product.
  • Customer service wait times: Long hold times or delayed responses to inquiries can lead to frustration, especially when customers expect prompt assistance.

Impact of Surface-Level Pain Points

While these issues are relatively minor on their own, they can have a cumulative effect. When customers encounter several small annoyances, it can deter potential buyers and negatively impact customer satisfaction scores. Addressing these issues promptly is a quick win that can enhance user experience without requiring extensive resources.

IDENTIFY  ADDRESS 

Customer feedback surveys: Regularly surveying customers allows you to identify frequent, recurring issues. Keep these surveys brief to capture responses without adding to the frustration.

Quick-pulse surveys: A short survey right after a website visit or transaction can highlight specific areas of concern.

Social media monitoring: Track mentions on social media, as many customers share real-time frustrations in public forums.

Improve website and app performance: Ensure that your digital assets are optimized for fast load times and minimal errors.

Enhance customer service efficiency: Use automation to streamline responses and prioritize reducing hold times. Even chatbots can effectively address simple queries quickly.

Offer flexible options: Provide multiple payment methods, flexible delivery options, and a straightforward return policy to remove transaction friction.

Example: An e-commerce brand noted a high cart abandonment rate due to limited payment options. By adding more payment methods, they reduced abandonment by 15%, leading to increased conversions.


Level 2: Process and Experience Pain Points (Repeated Frustrations)

The second level consists of process and experience pain points—repeated frustrations that disrupt the customer journey and lead to dissatisfaction over time. These issues are often tied to the brand’s processes or service interactions and can create a lasting impact on customer sentiment if not resolved.

Examples of Process and Experience Pain Points

  • Complex onboarding process: A complicated onboarding process can deter customers from engaging fully with a product or service.
  • Inconsistent customer service: When customer service quality fluctuates, customers may feel that they can’t rely on the brand for help, leading to trust issues.
  • Redundant steps in processes: Requiring customers to repeat information or complete multiple steps to achieve a simple goal can be frustrating and deter them from completing tasks.
  • Confusing website or app navigation: Poorly designed interfaces can lead to frustration as customers struggle to find the information or features they need.

Impact of Process and Experience Pain Points

These recurring frustrations can gradually erode trust and loyalty, as customers start to feel that the brand doesn’t care about delivering a seamless experience. If customers constantly face issues in navigating the website, reaching customer service, or using a product, they may seek alternatives with more user-friendly options.

IDENTIFY ADDRESS

Customer journey mapping: Analyze the end-to-end customer journey to identify points where users encounter obstacles or drop-off points.

Customer service data analysis: Review customer service logs to identify recurring complaints or issues that point to process flaws.

Qualitative interviews and focus groups: In-depth interviews can reveal how customers feel about processes and where they get frustrated, providing insights that quantitative data may miss.

Simplify processes: Streamline onboarding, purchasing, or service processes to eliminate unnecessary steps.

Consistency in customer service: Train support teams to provide consistent responses, set service standards, and use tools to ensure seamless experiences across channels.

Improve navigation: Conduct usability testing to refine your website or app structure, ensuring it’s intuitive and easy to navigate.

Example: A SaaS company found that its lengthy onboarding process led to a high drop-off rate. By simplifying onboarding, they reduced churn during the first month and increased overall engagement.

Level 3: Deep-Seated Pain Points (Emotional and Psychological Barriers) 

At the deepest level, there are emotional and psychological pain points. These stem from a lack of alignment between the brand and the customer’s values or beliefs and are often rooted in trust issues or unmet emotional needs. These are the most challenging pain points to address, as they are often not about functionality but about how the brand makes customers feel.

Examples of Deep-Seated Pain Points

  • Lack of transparency: When customers feel that a brand is not being upfront about its pricing, policies, or practices, it can erode trust.
  • Feeling undervalued: Customers want to feel valued and appreciated. A lack of personalization, or feeling like just another number, can lead to dissatisfaction.
  • Privacy concerns: With rising concerns around data privacy, brands that aren’t transparent about how they handle customer data risk alienating their audience.
  • Brand values mismatch: If a brand’s values or messaging conflict with a customer’s beliefs or lifestyle, it can drive them away. For instance, consumers increasingly prefer brands with eco-friendly practices; failure to adopt these may alienate environmentally conscious customers.

Impact of Deep-Seated Pain Points

These issues can be the most damaging to long-term loyalty. When customers feel emotionally disconnected or lose trust in a brand, they are likely to disengage and may spread negative word-of-mouth, impacting the brand’s reputation more broadly.

IDENTIFY ADDRESS

In-depth interviews: One-on-one interviews allow customers to express their deeper feelings about the brand.

Sentiment analysis: Analyze customer feedback, reviews, and social media conversations to gauge the overall sentiment and detect emotional triggers.

Focus groups: Gather small groups of customers to discuss their experiences, probing for deeper reasons behind their preferences and frustrations.

Build transparency and trust: Ensure clear, open communication around policies, pricing, and practices, and proactively address customer concerns about privacy.

Personalize interactions: Use data to personalize communications and offers, showing customers that you see and value them as individuals.

Align brand values with customer expectations: Be authentic in your messaging and ensure that your values resonate with those of your target audience. If environmental or social issues matter to your customers, incorporate them genuinely into your brand ethos.

Example: A consumer electronics brand addressed privacy concerns by openly communicating how customer data is stored and used, improving trust and reducing negative sentiment around data handling.

Strategies for Managing Pain Points Across Levels

Understanding the three levels of pain points is a strong foundation, but an effective strategy requires the right approach to prioritize and address these issues.

Prioritize Based on Impact

Not all pain points carry the same weight. Use customer insights to prioritize pain points based on their impact on satisfaction and loyalty. Addressing deep-seated pain points may be more challenging, but they can have a more profound effect on loyalty than surface-level frustrations.

Continuous Improvement

Establish an ongoing feedback loop to capture emerging pain points, as customer expectations evolve over time. Regularly revisit and update processes, products, and customer interactions to keep up with changing needs.

Empower Cross-Functional Teams

Engage cross-functional teams in addressing pain points. Customer experience touches every part of the business, from product development to marketing and customer support. A collaborative approach ensures that pain points are identified and resolved comprehensively.

To summarize, understanding and addressing pain points at all three levels can transform your customer experience strategy. By resolving transactional issues, simplifying processes, and tackling deeper emotional barriers, brands can create a more satisfying, trusted experience that keeps customers engaged and loyal.


Estimated Read Time
6 min read

How to Analyze Survey Results: A Guide for Unlocking Consumer Insights

Before jumping to analysis, let’s start by noting the obvious, that many surveys use a mixed-methods approach, combining both closed- and open-ended questions. This approach allows researchers to gather broad quantitative data for statistical purposes while also collecting qualitative data that adds necessary context and depth.

What is quantitative data? What is qualitative data? What are their key differences?

Quantitative data refers to information that can be measured and expressed numerically. It involves quantities, amounts, and numerical values that allow for statistical analysis. This type of data can be counted, measured, and compared in terms of numbers and often includes metrics like height, weight, age, temperature, and test scores. Quantitative data is typically used when objective, measurable information is needed, and it answers questions like "how many," "how much," or "how often."

In contrast, qualitative data refers to descriptive information that characterizes but doesn’t measure. This data type provides insights into qualities, characteristics, and attributes and is often collected through methods like interviews, observations, and open-ended surveys. Qualitative data might describe things like color, texture, emotions, experiences, or preferences and answers questions like "what kind," "how," or "why."

Key differences

  1. Nature of Data: Quantitative data is numerical, while qualitative data is descriptive.
  2. Purpose: Quantitative data focuses on quantifying characteristics, while qualitative data explores understanding and depth.
  3. Analysis Methods: Quantitative data is analyzed using statistical methods, whereas qualitative data is often analyzed through thematic or content analysis.

Surveys are powerful tools that can help you understand what your customers think, feel, and need. But collecting data is just the first step; the real value comes from analyzing it in a way that reveals actionable consumer insights. In this guide, we’ll walk you through a structured approach to analyzing survey data like a data pro. Whether you’re in marketing, product development, or customer service, these steps will help you make informed, data-backed decisions.

Step 1: Prepare Your Data for Analysis

Before diving into analysis, it’s essential to clean and organize your data to ensure accuracy and consistency.

Clean Your Data

Cleaning data involves removing incomplete responses, addressing any obvious errors, and checking for consistency. For instance, if you notice multiple entries with the same IP address or duplicates, consider filtering these out, as they could skew the results.

Organize and Categorize Responses

For easier analysis, organize responses by key demographics, segments, or categories. For example, if you’ve collected age and gender data, segmenting responses by these variables can help you identify trends within specific groups.

Example: Segmenting responses by age group can help identify patterns, such as younger consumers preferring digital communication channels over in-store experiences.

Standardize Formats

To compare data consistently, ensure that you’re using standard formats. For example, if your survey included a question on rating satisfaction from 1 to 10, make sure all responses are recorded on this scale without discrepancies. This step minimizes the risk of misinterpretation during analysis.

Step 2: Start with Descriptive Analysis

Descriptive analysis gives you a snapshot of your survey data, helping you quickly identify overall trends and averages.

Analyze Basic Metrics

For closed-ended questions, calculate key metrics like frequencies (how often each response was selected), averages, and percentages. This analysis provides an overview of how respondents feel about certain topics.

Use Data Visualizations

Visual tools like bar charts, pie charts, and histograms make it easier to digest information at a glance. Charts help highlight significant trends and can make insights more accessible when presenting findings to non-data professionals.

Identify High-Level Patterns

Look for patterns and outliers. For example, if you see that a large majority rates a feature as very important, that’s a strong signal. Conversely, any unexpected outliers might indicate areas needing further investigation.

Example: A bar chart showing feature preferences could reveal that 80% of respondents value “ease of use” most in your app, while only 15% value “customization options.”

Step 3: Go Deeper with Cross-Tabulation

Cross-tabulation is a method that allows you to explore relationships between variables by comparing data across different segments.

Identify Relationships Between Variables

Cross-tabulate responses to see correlations and patterns between different questions. For instance, cross-tabulating customer satisfaction with customer service ratings can reveal if high-quality service correlates with overall satisfaction.

Uncover Segment-Specific Insights

Examining how responses differ by demographic or psychographic variables can give you a clearer picture of your audience’s preferences. For example, comparing satisfaction scores across different age groups may show that younger customers value certain features differently than older ones.

Example: Cross-tabulating purchase intent with age group could reveal that respondents aged 18-24 are more likely to express high purchase intent for eco-friendly products, providing a targeted opportunity.

Step 4: Analyze Open-Ended Responses

Open-ended responses provide rich qualitative data that can offer deeper insights into consumer attitudes, motivations, and expectations. However, they require a more nuanced approach to analysis.

Code and Categorize Responses

Coding involves categorizing similar responses into themes or topics. This can be done manually or with the help of text analysis tools. Coding makes it easier to quantify open-ended responses and identify recurring themes or opinions.

Text Analysis and Sentiment Analysis

Use text analysis to spot commonly used words and phrases, and apply sentiment analysis to gauge the tone of responses. This approach can help you understand the general sentiment around a product or feature.

Example: If several respondents mention that your website is “confusing,” you can code this feedback under the theme of “usability issues” and prioritize website improvements

Step 5: Use Statistical Testing for Deeper Insights 

Statistical testing can confirm whether patterns you observe are meaningful or just random noise.

Hypothesis Testing

If you have assumptions based on initial observations, use hypothesis testing to validate these. For instance, you might hypothesize that a new feature has led to increased customer satisfaction and then conduct tests to see if satisfaction scores differ significantly before and after implementing the feature.

Confidence Intervals and Significance 

Confidence intervals allow you to determine how certain you can be about survey results. For instance, a 95% confidence interval indicates a high level of certainty, while significance testing ensures that observed differences (e.g., higher satisfaction among a certain group) are statistically meaningful.

Example: Conduct a t-test to assess if customer satisfaction ratings significantly differ between users in two geographic regions. This could indicate regional preferences or expectations.

Step 6: Apply Advanced Analytics (If Needed) 

For more in-depth insights, consider advanced analytics techniques that provide a multi-dimensional view of your data.

Segmented Cluster Analysis 

Cluster analysis groups respondents into segments based on similarities in their responses, helping you identify distinct audience types. In marketing, cluster analysis can reveal target segments with unique preferences or pain points, informing targeted strategies.

Regression Analysis 

Regression analysis identifies which factors most impact customer satisfaction, loyalty, or purchase intent. For instance, you can use regression to see how satisfaction scores are influenced by product features, customer service quality, or price.

Example: A regression analysis might show that satisfaction scores are most strongly influenced by customer service response time and product usability, pointing to areas for improvement.

Step 7: Synthesize Insights and Form Conclusions 

Once you’ve completed your analysis, it’s time to synthesize findings and translate them into actionable insights.

Summarize Key Findings

Highlight the most critical insights that align with your business goals. Rather than overwhelming stakeholders with all data points, focus on the metrics that will have the biggest impact on decision-making.

Develop Actionable Recommendations

Use insights to inform strategic recommendations. For example, if survey results reveal that customers value a specific product feature, you might prioritize that feature in marketing materials or product updates.

Example: If data shows that convenience and ease of use are top priorities for your customers, you might recommend simplifying the product onboarding process to improve user experience and satisfaction.

Step 8: Present Your Survey Results 

Presenting survey results effectively is as important as the analysis itself, especially when communicating with stakeholders who may not be familiar with data interpretation.

Choose the Right Visualizations

Select visualizations that make complex data clear and intuitive. For example, use heat maps for satisfaction scores across different customer segments or infographics for a high-level summary of findings.

Tailor Insights for Stakeholders 

Frame your findings based on the interests and needs of each department. For example, the marketing team might need insights on brand perception, while product development may focus on feature satisfaction.

Create a Clear Summary

Provide an executive summary that includes key takeaways and actionable points, making it easy for stakeholders to understand the implications and recommendations.

Example: A report could include an infographic summarizing key customer preferences, followed by detailed segment insights and specific actions for each department.

Conclusion and Next Steps

Mastering survey analysis can significantly enhance your ability to understand customer needs and make informed business decisions. By following these steps, you’ll be equipped to analyze survey data like a pro, translating raw data into insights that drive strategy and improve customer satisfaction.

When running your next survey, remember that each step—cleaning data, performing descriptive and advanced analysis, and presenting findings—is essential to delivering meaningful, actionable insights. By treating survey analysis as both a science and an art, you can unlock the full potential of consumer insights and ensure your decisions are informed by accurate, in-depth data.

Call to Action

Ready to turn survey data into powerful insights? Start by applying these steps to your next consumer survey, or consider leveraging data collection, analysis, and visualization tools like SightX to streamline the process. With SightX, you can efficiently collect, analyze, and visualize  survey data and uncover actionable insights that guide impactful, customer-centric strategies.

By following this structured approach, marketers and insights professionals can approach survey data analysis confidently, knowing that their decisions are grounded in a thorough understanding of consumer needs and preferences.


Estimated Read Time
7 min read