The Top Consumer Insights Tools of 2024

Understanding your target market is a central factor in your business's success. But consumer behavior evolves rapidly, so you have to be agile and informed to meet your market's changing needs and preferences.

Having the proper insight tools at your disposal can make the difference between thriving and merely surviving. These tools enable you to dive deep into consumer behavior, preferences, and trends, providing clear data points for strategic decision-making. 

Here's a look at the top 10 consumer insights tools of 2024.


1. SightX

SightX is an innovative automated consumer insights platform that helps businesses understand their customers better. SightX offers powerful data collection, analysis, and visualization tools, making it easier for companies to gather actionable insights quickly.

Key Features

bullet point green checkmarkComprehensive survey and concept test design and distribution
bullet point green checkmarkKey market research methodologies such as TURF, MaxDiff, or Key Driver Analysis
bullet point green checkmarkAdvanced data analytics and visualization
bullet point green checkmarkReal-time data collection, analytics, and reporting
bullet point green checkmarkUse Generative AI to create, analyze, and summarize studies with a prompt.


Use Case

SightX is perfect for businesses looking to streamline their consumer insights process with a robust, all-in-one platform. It is especially beneficial for companies that need to conduct extensive market research, gather customer feedback, and make data-driven decisions to enhance their product offerings and marketing strategies.


SightX Consumer Insights Platform Screenshot


2. Google Analytics 4

The latest version of Google Analytics, GA4, offers enhanced data collection and analysis capabilities, focusing on user-centric measurements. It's designed to provide a more complete understanding of user behavior across different devices and platforms.


Key Features

bullet point green checkmarkCross-platform tracking
bullet point green checkmarkAdvanced machine learning models
bullet point green checkmarkDeeper insights into user journeys
bullet point green checkmarkEnhanced data privacy and compliance features
bullet point green checkmarkSimplified event tracking setup


Use Case

GA4 is essential for businesses that need to understand user interactions across web and mobile platforms. It helps marketers and analysts make data-driven decisions, optimize user experiences, and measure the effectiveness of their marketing efforts.


This image shows a screenshot of the GA4 platform from Workshop Digital


3. Tableau

Tableau is a powerful data visualization tool that transforms raw data into actionable insights through interactive dashboards and reports. Tableau's user-friendly interface allows users to create visually appealing and informative charts without needing deep technical skills.


Key Features

bullet point green checkmarkIntuitive drag-and-drop interface
bullet point green checkmarkWide range of data connectors
bullet point green checkmarkReal-time data analysis
bullet point green checkmarkAdvanced data blending and joining capabilities
bullet point green checkmarkExtensive library of visualization types


Use Case

Perfect for companies that need to visualize large datasets and uncover trends quickly. Tableau is widely used across industries to create dynamic dashboards that provide insights at a glance, helping businesses make informed decisions.


4. HubSpot

HubSpot is an all-in-one inbound marketing, sales, and service platform with tools for capturing and analyzing consumer insights. HubSpot's integrated approach helps businesses streamline their marketing efforts and drive growth.


Key Features

bullet point green checkmarkCustomer journey tracking
bullet point green checkmarkComprehensive analytics and reporting
bullet point green checkmarkCRM integration
bullet point green checkmarkMarketing automation tools
bullet point green checkmarkPersonalized content delivery


Use Case

HubSpot is ideal for businesses looking to integrate consumer insights into their marketing and sales strategies. Its powerful analytics and CRM capabilities make it easier to track customer interactions and measure campaign effectiveness.


Screenshot of the hubspot platform from Monday.com


6. Sprout Social

Sprout Social is a social media management platform providing deep insights into performance and audience behavior. It helps businesses manage their social media presence, engage with their audience, and measure the impact of their social media efforts.


Key Features

bullet point green checkmarkSocial listening and monitoring
bullet point green checkmarkAdvanced analytics and reporting
bullet point green checkmarkScheduling and publishing tools
bullet point green checkmarkCompetitor analysis
bullet point green checkmarkSocial media automation


Use Case

Spout Social is essential for businesses aiming to enhance their social media presence and engagement. Its comprehensive tools help brands understand what resonates with their audience and optimize their social media strategies accordingly.


7. NielsenIQ

NielsenIQ offers comprehensive consumer insights and analytics, focusing on retail and consumer goods. NielsenIQ provides detailed market analysis, helping businesses understand consumer behavior and trends.


Key Features

bullet point green checkmarkIn-depth market analysis
bullet point green checkmarkConsumer behavior tracking
bullet point green checkmarkCustomizable reports
bullet point green checkmarkGlobal data coverage
bullet point green checkmarkIndustry-specific insights


Use Case

It is ideal for retail and FMCG companies looking to understand market trends and consumer preferences. NielsenIQ's extensive data and analysis capabilities help businesses make informed strategic decisions.


A screenshot of the NielsenIQ Platform


8. Adobe Analytics

Adobe Analytics is a powerful tool that provides deep insights into customer behavior across digital channels. Adobe Analytics leverages machine learning to deliver predictive insights and recommendations.


Key Features

bullet point green checkmarkReal-time data collection
bullet point green checkmarkAdvanced segmentation and targeting
bullet point green checkmarkIntegration with Adobe Experience Cloud
bullet point green checkmarkPredictive analytics
bullet point green checkmarkCustomizable dashboards


Use Case

Adobe Analytics is great for businesses that need detailed insights into digital interactions and marketing effectiveness. It helps marketers optimize their digital strategies and improve customer experiences.


9. Brandwatch

Brandwatch is a social listening and analytics platform that provides insights into brand perception and consumer sentiment. Brandwatch uses AI to analyze social media data and uncover trends and insights.


Key Features

bullet point green checkmarkSocial listening and monitoring
bullet point green checkmarkAdvanced sentiment analysis
bullet point green checkmarkCustomizable dashboards
bullet point green checkmarkInfluencer identification
bullet point green checkmarkCompetitive analysis


Use Case

Brandwatch is ideal for brands looking to monitor their online reputation and understand consumer sentiment. Its powerful analytics help businesses stay ahead of trends and manage their brand image effectively.


A screenshot of the Brandwatch Consumer Insights Platform


10. Hotjar

Hotjar is a user behavior analytics tool that provides insights through heatmaps, session recordings, and surveys. Hotjar helps businesses understand how users interact with their websites and identify areas for improvement.


Key Features

bullet point green checkmarkHeatmaps and session recordings
bullet point green checkmarkInstant feedback tools
bullet point green checkmarkConversion funnels
bullet point green checkmarkForm analysis
bullet point green checkmarkUser surveys and polls


Use Case

Hotjar is perfect for businesses looking to optimize their website's user experience. Its tools provide a clear picture of user behavior, helping businesses enhance usability and increase conversions.


11. Statista

Statista is a leading statistics portal that provides access to a wealth of market and consumer data. Statista offers comprehensive data sets and industry reports, making it a valuable resource for market research.


Key Features

bullet point green checkmarkComprehensive data sets
bullet point green checkmarkIndustry reports and forecasts
bullet point green checkmarkCustomizable infographics
bullet point green checkmarkGlobal data coverage
bullet point green checkmarkData export and API access


Use Case

Statista is great for businesses needing reliable market analysis and strategic planning data. Its extensive data library helps businesses stay informed about market trends and consumer behavior.


Incorporating any combination of these tools into your strategy can lead to deeper and more meaningful engagements with your audience. Whether you're aiming to optimize marketing campaigns, improve customer experience, or stay ahead of market trends, leveraging the right consumer insights tools is essential for success.


Collecting Consumer Insights with SightX

Historically, consumer insights work has been costly, time-consuming, and inaccessible. So we decided to change that.

The SightX Platform combines the power of generative AI with advanced consumer insights tools to help you get better insights faster.

bullet point green checkmarkCreate a fully customized survey or experiment with a prompt.
bullet point green checkmarkCollect data from your target audience.
bullet point green checkmarkReceive thoroughly analyzed and summarized results in seconds, revealing key insights and personalized recommendations.

See how simple collecting powerful insights can be.


Estimated Read Time
4 min read

Consumer Spending Outlook: Summer 2024

Despite most economic indicators showing the US economy is in good shape by historical standards, consumer confidence has begun to dip once again, according to AP News. 

Curious to understand the reasons behind this trend, we conducted a study that revealed that finances are a growing source of stress for most Americans. In fact, one-third of respondents rated their budget concerns as a 10 out of 10. 

Given these circumstances, it's understandable that many are cutting back on spending. However, our research shows that there are certain areas where people are actually choosing to spend more.

Today, we'll analyze the findings from our latest research to explore how people are planning to save money and where they intend to splurge for the back half of 2024. 


Saving & Splurging


Saving: Less time online, more time outside. 

According to our data, 76% of people plan to enjoy some outdoor fitness activity at least once per week this summer. Many of the most popular planned activities were free, like swimming or hiking. 

Interestingly, a not-so-small contingent of the population (30%) plans to actively spend less time on social media this summer. 

These two stats together paint quite the picture. 

With a looming US presidential election, wars, and sustained economic hardships, people are seeking quiet, reflective, and (sometimes) internet-free spaces to spend their time. 

Studies show that spending as little as 20 minutes a day outside can reduce stress (National Recreation & Park Association). Doom scrolling on social media for 20 minutes will likely just spike your anxiety. 

For brands and advertisers, this may lead to slower engagement throughout the end of summer and potentially into the fall as people look for an escape. This means every interaction with your audience must be intentional and impactful. 


Splurging: Travel Experiences 

As our summer travel report noted, 44% plan to travel this summer (35% are considering it). 

Despite considerable concerns about their budgets, many people are actually planning to spend more on travel this summer. According to our research, 61% of consumers have kept tighter travel budgets in recent years, planning for $1000 or less per trip. 

Now, 54% are budgeting in the $1k-$5k range, signifying significant growth in travel spending. 

Why? Hilton's CFO & President of Global Development, Kevin Jacobs, had great insight into this inconsistency in Forbes 2024 Travel Trends: 

"Even with ongoing macroeconomic uncertainty, travel demand has remained strong as consumers continue to prioritize the value of experiences and connections over things."

Much like time spent outdoors, travel also offers a unique way to spend more time in the moment and less on the internet. 


Saving: Unnecessary spending 

Throughout our study, we've seen that many are spending their summer doing things to better their mental health. Whether it's spending more time outdoors, traveling more often, or using social media less, people are trying to protect their peace this summer. And this will affect their spending.

Interestingly, Forrester predicted as much in their 2024 Predictions piece: 

"….consumers will exercise better awareness and habits with their wallets, devices, and minds. As consumers strive for more calm in their lives, another storm will brew, spawned by three major world events: the Paris 2024 Summer Olympics, a US presidential election, and the campaign for the next UK general election." 

The data clearly shows that people are indeed exercising better awareness and habits with their devices and minds. And unsurprisingly, they are also flexing more control over their wallets. 

Moving forward, we can expect to see cuts on "unnecessary" spending. Only 33% of respondents in our study planned to shop for clothing items this summer, and nearly half (41%) were planning to limit their dining out to once per week.


About SightX

By infusing the power of generative AI with advanced market research studies and survey tools, SightX makes collecting insights a breeze.

Green checkmark bullet point. Create a fully customized survey, study, or experiment with a prompt.
Green checkmark bullet point. Collect data from your chosen audience. 
Green checkmark bullet point. Receive fully analyzed and summarized results in seconds, revealing key insights and personalized recommendations.

Let us show you how simple it can be to collect powerful insights.


Estimated Read Time
3 min read

9 Essential Tools for Package Design Testing

Product packaging is crucial in attracting consumers and conveying your brand's message. To ensure your packaging stands out and meets customer expectations, it's essential to test your designs thoroughly.


Here are nine tools you can use for seamless package design testing:


1. SightX


SightX offers comprehensive research and analytics tools, enabling you to gather qualitative and quantitative data on your packaging designs. With advanced data visualization and real-time insights, you can make informed decisions to improve your packaging.

Key Features:

bullet point green checkmarkSurvey creation, distribution, and data analysis
bullet point green checkmarkAutomated methodologies like concept testing, maxdiff, conjoint, and Key Driver Analysis. 
bullet point green checkmarkReal-time data analytics
bullet point green checkmarkAdvanced data visualization tools
bullet point green checkmarkEasy-to-use interface


SightX Product Design Testing Platform Screenshot-1


2. UserTesting 

UserTesting connects you with a diverse pool of testers who provide real-time feedback on your packaging designs. This platform is ideal for observing how consumers interact with your packaging in a natural setting.


Key Features:

bullet point green checkmarkVideo-based feedback
bullet point green checkmarkReal-time user interactions
bullet point green checkmarkDiverse tester pool
bullet point green checkmarkActionable insights


3. lyssna 

Lyssna offers a suite of tools for testing visual elements, including packaging designs. It lets you gather quick feedback from real users on various design aspects.

Key Features:

bullet point green checkmarkPreference tests
bullet point green checkmarkDesign comparison tests
bullet point green checkmarkClick tests
bullet point green checkmarkComprehensive reporting


A screenshot of the Lyssna platform for product design testing. Source: SaasWorthy.


4. lookback

Lookback is a user research platform that facilitates live interviews and recorded sessions. It lets you observe how consumers perceive and interact with your packaging designs.

Key Features:

bullet point green checkmarkLive and recorded user sessions
bullet point green checkmarkCollaborative analysis
bullet point green checkmarkHigh-quality video and audio
bullet point green checkmarkEasy participant recruitment


5. Loop11

Loop11 is a usability testing tool for evaluating the effectiveness of packaging designs. It offers both qualitative and quantitative insights into user interactions.

Key Features:

bullet point green checkmarkTask-based testing
bullet point green checkmarkHeatmaps and click tracking
bullet point green checkmarkReal-time analytics
bullet point green checkmarkMultilingual support


A screenshot from the Loop11 Platform showing a sample package design testing question analysis.


6. Hotjar

Hotjar provides various tools to analyze user behavior and gather feedback on your packaging designs. Its heatmaps and session recordings offer deep insights into consumer interactions.

Key Features:

bullet point green checkmarkHeatmaps
bullet point green checkmarkSession recordings
bullet point green checkmarkSurvey and feedback tools
bullet point green checkmarkFunnel analysis

7. Optimal Workshop

Optimal Workshop is a suite of usability testing tools that helps you gather feedback on your packaging designs. It offers various methods for testing and refining your designs.

Key Features:

bullet point green checkmarkCard sorting
bullet point green checkmarkTree testing
bullet point green checkmarkFirst-click testing
bullet point green checkmarkDetailed analytics

8. Maze

Maze is a rapid testing platform that allows you to validate your packaging designs with real users. It offers actionable insights to help you make data-driven decisions.

Key Features:

bullet point green checkmarkRapid prototype testing
bullet point green checkmarkIn-depth user insights
bullet point green checkmarkComprehensive reporting
bullet point green checkmarkEasy integration with design tools


9. Adobe XD

Adobe XD is a robust design and prototyping tool with features for testing packaging designs. It allows you to create interactive prototypes and gather user feedback.

Key Features:

bullet point green checkmarkInteractive prototyping
bullet point green checkmarkReal-time collaboration
bullet point green checkmarkUser testing features
bullet point green checkmarkIntegration with other Adobe tools


Screenshot from the Adobe XD platform that can be used for package design.


SightX's Package Design Testing Tools

Effective package design testing is crucial for creating packaging that attracts consumers and effectively communicates your brand's message.

With SightX, you can combine the power of generative AI with advanced design testing tools to get deeper insights.

bullet point green checkmarkCreate a fully customized survey or experiment with a prompt.
bullet point green checkmarkCollect data from your target audience.
bullet point green checkmarkReceive fully analyzed and summarized results in seconds, revealing key insights and personalized recommendations.


Get access to tools like: 


Concept Testing

Conduct surveys or focus groups to gather feedback on different packaging concepts. This method helps you understand consumer preferences and identify the most promising design directions.

Heatmapping

Use heat mapping tools to analyze where consumers' eyes are drawn to your packaging. This method helps you identify your design's most and least noticed elements, allowing you to optimize visual hierarchy.

Automated MaxDiff Analysis

Measure the level of importance consumers place on each product feature to optimize your product and messaging. 


Let us show you how simple it can be to collect powerful package design insights. 


Estimated Read Time
2 min read

Psychographic Survey Questions: What They Are and How to Use Them in Market Research

Understanding your customers goes beyond simply knowing their age, income, and location. To truly connect with your audience, you must look deeper into their lifestyles, attitudes, interests, and values.


This is where psychographic survey questions come into play.

Today, we'll explore what psychographic survey questions are, when to use them, how to leverage the data they provide, and share tips for writing better psychographic survey questions.


What are Psychographic Survey Questions?

Psychographic survey questions aim to uncover consumers' psychological attributes, including their lifestyle, interests, opinions, values, and personality traits. Unlike demographic data, which categorizes people based on observable characteristics, psychographic data gives insights into the motivations that drive their decisions. This type of data is invaluable for businesses looking to create deeper connections with their audience.


Examples of Psychographic Questions

To illustrate, here are some examples of psychographic survey questions:

bullet point green checkmarkHobbies and Activities: "What hobbies or activities do you enjoy in your free time?" This question helps you understand what your customers do for fun, providing insights into potential partnerships or sponsorships that align with their interests.
bullet point green checkmarkWeekend Plans: "How do you typically spend your weekends?" Knowing how your audience spends their weekends can help tailor marketing messages to align with their weekend activities.
bullet point green checkmarkCore Values: "What are your core values in life (e.g., family, career, health, adventure)?" This question is crucial for brand positioning and creating messages that resonate with your audience's core beliefs.
bullet point green checkmarkSustainability Importance: "How important is sustainability when choosing products to buy?" This can inform decisions around product development and marketing for environmentally conscious consumers.
bullet point green checkmarkSocial Media Usage: "What are your main motivations for using social media?" Understanding why your audience uses social media can help tailor your strategy to engage them better.
bullet point green checkmarkFinancial Approach: "How would you describe your approach to managing finances (e.g., cautious, impulsive, balanced)?" This can influence how you market financial products or services.
bullet point green checkmarkShopping Style: "Which of the following best describes your shopping style: planner, bargain hunter, impulse buyer, or brand loyalist?" This question helps you segment your audience based on their shopping behavior and tailor marketing messages accordingly.


These questions help build a more comprehensive profile of your audience, revealing who they are and why they behave the way they do. Psychographic insights allow businesses to create more personalized and impactful marketing strategies that resonate deeply with their target audience.


When are Psychographic Questions Used in Surveys?

Psychographic questions are particularly useful in various market research scenarios. They provide depth and context that purely demographic data cannot, making them invaluable for understanding and predicting consumer behavior.


Customer Segmentation

Psychographic data is essential for dividing your audience into distinct segments based on shared traits. Unlike demographic segmentation, which might group customers by age or income, psychographic segmentation groups them by lifestyle, values, or personality traits. This allows for more nuanced marketing strategies that appeal more effectively to specific segments.


Product Development

Understanding what drives customers' needs and preferences is crucial for developing products that meet their expectations. Psychographic data provides insights into purchasing decisions' motivations, helping businesses innovate and tailor their products to better align with customer desires.


Marketing Campaigns

Tailoring messages and creative content to resonate more deeply with specific audience segments is a key use of psychographic data. By understanding your audience's interests and values, you can create marketing campaigns that speak directly to their motivations and aspirations, increasing engagement and conversion rates.


Brand Positioning

Aligning your brand with the values and lifestyles of your target market fosters stronger emotional connections. Psychographic insights can inform brand messaging and positioning strategies, ensuring your brand resonates more deeply with your audience.


Customer Loyalty Programs

Designing loyalty programs that align with customers' interests and values can significantly enhance engagement and retention. Psychographic data helps create personalized rewards and experiences that are meaningful to customers, fostering long-term loyalty.


How to Use Psychographic Data from Surveys

Once you've collected psychographic data, it's essential to analyze and apply it effectively. Here's how you can leverage this data to inform your business strategies:


Create Detailed Buyer Personas

Combine psychographic data with demographic information to build rich, detailed buyer personas. These personas should capture your target audience's essence, motivations, challenges, and preferences. Detailed personas guide your marketing strategies and product development efforts, ensuring they align with your audience's needs and desires.


Tailor Marketing Messages

Use the insights to craft personalized marketing messages that speak directly to the motivations and interests of different audience segments. Tailored messages resonate more deeply with consumers, increasing the likelihood of engagement and conversion. For example, if your audience values sustainability, emphasize your brand's commitment to eco-friendly practices in your marketing materials.


Optimize Product Offerings

Adjust your product features, packaging, and positioning to better align with the psychographic profiles of your customers. Understanding what drives your customers' purchasing decisions allows you to refine your product offerings to meet their needs more effectively. For instance, if your customers are health-conscious, you might focus on promoting the health benefits of your product.


Improve Customer Experiences

Design customer experiences that resonate with your audience's lifestyle and values, from website design to customer service. Psychographic insights can inform every aspect of the customer journey, ensuring that each touchpoint aligns with your audience's expectations and desires. For example, if your audience values convenience, focus on creating a seamless and hassle-free customer experience.


Refine Ad Targeting

Use psychographic insights to improve the targeting of your digital advertising campaigns, ensuring your ads reach the right people with the right message. By understanding the interests and values of your audience, you can create more relevant and impactful ad campaigns. For example, if your audience enjoys outdoor activities, consider targeting them with outdoor adventure ads.


10 Tips for Writing Better Psychographic Survey Questions

Here are 10 tips for writing your own psychographic questions: 

1. Be Specific: Ask clear, specific questions to get detailed and actionable insights. Avoid vague questions that might lead to ambiguous answers.


2. Use Open-Ended Questions: Incorporate open-ended questions to allow respondents to express their thoughts freely. This can provide deeper insights into their motivations and attitudes.


3. Avoid Leading Questions: Ensure your questions are neutral and unbiased to avoid influencing respondents' answers. Leading questions can skew your data and provide inaccurate insights.


4. Use a Mix of Question Types: Combine multiple-choice, scale-based, and open-ended questions to gather a range of data. This helps capture both quantitative and qualitative insights.


5. Keep it Relevant: Tailor your questions to the context of your research and the goals you aim to achieve. Irrelevant questions can frustrate respondents and lead to low-quality data.


6. Focus on Interests and Values: Ask about activities, hobbies, and values that can reveal deeper insights into consumer behavior. These aspects are often more predictive of behavior than demographic data alone.


7. Incorporate Behavioral Questions: Include questions about past behaviors to understand habits and preferences. Past behavior is often a good predictor of future behavior.


8. Make It Relatable: Frame questions in a way that respondents can easily relate to and understand. Use language and examples that are familiar to your audience.


9. Ensure Anonymity: Assure respondents that their answers are confidential to encourage honesty. Anonymity can help respondents feel more comfortable sharing personal information.


10. Pilot Test Your Survey: Conduct a pilot test to identify any issues with question clarity and adjust accordingly before the full rollout. A pilot test can help ensure your questions are well understood and elicit the desired responses.


Designing Psychographic Surveys with SightX

Psychographic survey questions are a powerful tool in market research, offering deep insights into the psychological drivers behind consumer behavior.

Understanding your audience's lifestyles, interests, values, and motivations can create more effective marketing strategies, develop better products, and foster stronger customer connections. By following the tips for writing better psychographic survey questions, you can ensure your surveys are both effective and insightful, paving the way for more informed business decisions.

With SightX, you can combine the power of generative AI with advanced survey tools to ask better questions and get deeper insights.

bullet point green checkmarkCreate a fully customized survey, study, or experiment with a prompt.

bullet point green checkmarkCollect data from your target audience.

bullet point green checkmarkReceive fully analyzed and summarized results in seconds, revealing key insights and personalized recommendations.

Let us show you how simple it can be to collect powerful psychographic insights. 


Estimated Read Time
6 min read

28 Prompts You Can Use with Ada for Better Studies & Deeper Insights

Using clear and direct prompts can make all the difference when working with Generative AI tools. Why? 

Maybe you're familiar with the acronym GIGO? It stands for Garbage In, Garbage Out.

The acronym dates back to the late 1950s when US Army Specialist William Mellin explained that computers could not truly think for themselves, which meant that "sloppily programmed" inputs would lead to sloppy and/or incorrect outputs.  

Despite our advancements, this statement is as true today as it was back then. Especially when it comes to generative AI tools. 

Our Generative AI research consultant, Ada, is adept at creating custom projects and converting complex data into clear insights, but effective communication is critical for optimal results. Today, we're sharing powerful prompts you can use with Ada to create studies, uncover insights in your data, and get personalized recommendations for your goals. 


What are Prompts? And How Are They Used? 

While some of you may already be familiar with prompts, let's quickly cover the subject before we move on. 

Prompts are simply the instructions you give generative AI to produce an output. But prompts aren't just about asking your question or sharing your needs. When working with AI market research tools like Ada, a well-written prompt will include contextual details about your business, goals, or the challenges you are facing. 

When packaged together, this information allows generative AI tools like Ada to create tests tailored to your unique situation and pick our key insights in your analysis that she knows will be important to you.


Prompts to Use with Ada

Here are a list of the most powerful prompts you can use with Ada: 


Try giving Ada direct instructions: 

bullet point green checkmark"Can you summarize the themes found in the open text of question ___, and provide one supporting anecdote per theme?"

bullet point green checkmark"Can you help me create a survey to gather customer feedback on our new product? I'd like to get feedback on __, __, ___, and ___."

bullet point green checkmark"Help me identify key drivers of customer satisfaction and loyalty."

bullet point green checkmark"Build a TURF analysis project related to ___ to help me identify the optimal combination of dog food products to maximize reach and minimize overlap among my target audience."

bullet point green checkmark"I'm trying to explore a wide range of survey question types to measure ___. Can you build a study that contains different question and response option types for me to consider?"


Or, ask her the same questions you'd ask any market research consultant:

bullet point green checkmark"What are some effective ways to analyze survey data and extract meaningful insights?"

bullet point green checkmark"How can I use SightX to conduct market segmentation research?"

bullet point green checkmark"What are the best practices for designing a survey that yields accurate and reliable results?"

bullet point green checkmark"Can you provide tips on how to increase survey response rates?"

bullet point green checkmark"What sample size do I need to be sure my findings are statistically representative?"

bullet point green checkmark"What are some innovative survey question formats that can engage respondents?"

bullet point green checkmark"How can I use skip logic in my survey to personalize the respondent's experience?"

bullet point green checkmark"What are the key steps to follow when conducting a concept test for a new product idea?"

bullet point green checkmark"Can you explain the process of conducting a conjoint analysis using SightX?"

bullet point green checkmark"What are the benefits of using the Van Westendorp pricing model in market research?"

bullet point green checkmark"How can I use SightX to measure brand awareness and perception?"

bullet point green checkmark"What are the best practices for conducting a usability test for a website or app?"

bullet point green checkmark"Can you provide guidance on creating effective survey questions for measuring customer satisfaction?"

bullet point green checkmark"How can I use SightX to conduct a competitor analysis and gain insights into market positioning?"

 bullet point green checkmark"What are some effective ways to visualize survey data and present findings?"

bullet point green checkmark"Can you recommend strategies for conducting a successful NPS (Net Promoter Score) survey?"

bullet point green checkmark"What are the steps involved in conducting a Gabor Granger pricing study?"

bullet point green checkmark"Can you provide tips on creating an effective ad campaign based on survey insights?"

bullet point green checkmark"How can I use SightX to conduct message testing and optimize my marketing communications?"

bullet point green checkmark"What are the best practices for conducting a product evaluation survey?"

bullet point green checkmark"Can you explain the process of conducting a Max Diff experiment using SightX?"

bullet point green checkmark"What are the steps involved in creating a market segmentation survey using SightX?"

bullet point green checkmark"Can you provide guidance on creating effective survey questions for measuring brand loyalty?"


Generative AI Based Market Research with SightX

By infusing the power of generative AI with advanced ad testing tools, SightX make market research a breeze. 

Green checkmark bullet pointCreate a fully customized survey, study, or experiment with a prompt.
Green checkmark bullet pointCollect data from your target audience.
Green checkmark bullet pointReceive fully analyzed and summarized results in seconds, revealing key insights and personalized recommendations.

Let us show you how simple it can be to collect powerful insights. 


Estimated Read Time
3 min read

Ten Product Testing Survey Questions to Ask Your Market

Product testing is a critical phase in the product development process, ensuring that your offering meets the needs and expectations of your target market. Surveys and experiments are often used during this stage, providing valuable insights and helping you refine your product before launch.

Today, we'll explore product testing and ten essential product testing survey questions to ask your market.


What is Product Testing & When Should I Use it?

Product testing is a process through which a product is evaluated for its performance, quality, and usability before it reaches the market. The primary goal of product testing is to ensure that the product meets specific standards and satisfies customer expectations. This process involves a series of tests, from early-stage concept testing to in-home user trials.

Companies frequently use product testing to identify potential issues, gather feedback, and make necessary improvements to enhance the product's quality and user experience.

Product testing can be used at various stages of the development cycle. Initially, during the prototype phase, testing can help identify design flaws and functionality issues early on, allowing for cost-effective corrections. As the product nears completion, more rigorous testing ensures it meets industry standards and regulatory requirements. Additionally, product testing is crucial before a full-scale market launch to gather real-world feedback and gauge customer reactions. This helps companies make final adjustments and avoid potential recalls or negative reviews.

Overall, product testing is vital to mitigate risks, ensure product reliability, and enhance customer satisfaction, ultimately contributing to the product's success in the market.


10 Questions to Ask in Your Product Testing Survey


Question 1: How Likely Are You to Purchase This Product?

Purpose: This question assesses your product's interest and potential market demand. Understanding the likelihood of purchase helps you evaluate whether there is a viable market for your product. It also provides an early indication of how well your product aligns with customer needs and desires. High likelihood scores validate your product concept, while low scores suggest further refinement.


Question 2: What Do You Like Most About This Product?

Purpose: This question helps identify the product's most appealing features and benefits. By understanding what aspects of the product resonate most with customers, you can emphasize these elements in your marketing and product development. This feedback also lets you leverage your strengths and differentiate your product from competitors.


Question 3: What Do You Dislike About This Product?

Purpose: Uncovering any negative aspects or potential areas for improvement is crucial for product development. This question provides insights into what might turn customers away and helps you address these issues before launching the product. Understanding dislikes can lead to design modifications, feature enhancements, or other adjustments that increase overall satisfaction.


Question 4: How Does This Product Compare to Similar Products You Have Used?

Purpose: This question is designed to help you understand how your product compares to competitors in the eyes of your customers. Comparing your product to existing alternatives provides context for its relative strengths and weaknesses. This feedback can inform your competitive positioning, highlight areas where you excel, and identify areas where improvements are needed.


Question 5: How Easy is the Product to Use?

Purpose: Assessing user-friendliness is critical to identify any usability issues. This question helps determine if customers find the product intuitive and easy to use or if obstacles hinder their experience. Ease of use is a significant factor in customer satisfaction and retention, and addressing usability issues can lead to a more seamless user experience.


Question 6: What Improvements Would You Suggest for This Product?

Purpose: Gathering specific feedback on potential enhancements is essential for product iteration. This question encourages customers to share their ideas and suggestions for improvement, providing you with actionable insights. Implementing these suggestions can lead to a better product that effectively meets customer needs and enhances satisfaction.


Question 7: How Well Does the Product Meet Your Needs?

Purpose: This question helps determine if the product satisfies the needs and expectations of your target market. Understanding how well your product meets customer needs is crucial for its success. If the product meets or exceeds needs, it indicates a solid product-market fit. Conversely, if it falls short, it signals areas for improvement.


Question 8: How Satisfied Are You with the Product's Value for Money?

Purpose: Evaluating whether customers feel the product is worth its price is vital for pricing strategy. This question assesses the perceived value of your product relative to its cost. High satisfaction with value for money can justify your pricing, while low satisfaction may indicate a need to adjust pricing or enhance the product's perceived value.


Question 9: Would You Recommend This Product to Others?

Purpose: Measuring the likelihood of word-of-mouth promotion indicates customer satisfaction and loyalty. If customers are willing to recommend your product, it signifies a high level of trust and approval. Recommendations can significantly boost your product's reach and credibility, making this question a key metric for gauging overall satisfaction.


Question 10: What Additional Features Would You Like to See in This Product?

Purpose: Identifying potential enhancements that could increase the product's appeal is crucial for ongoing development. This question solicits customer input on new features or improvements, providing you with ideas to keep your product competitive and aligned with customer expectations. Adding desirable features can enhance user satisfaction and product differentiation.


Product Testing with SightX

Having the right tools and technologies is crucial if you want to collect relevant product testing insights.

By infusing the power of generative AI with advanced product research tools, SightX makes collecting insights a breeze.

Green checkmark bullet point. Create fully customized surveys, studies, and experiments with a prompt.
Green checkmark bullet point. Collect data from your target audience.
Green checkmark bullet point. Receive fully analyzed and summarized results in seconds, revealing key brand insights and personalized recommendations.

Whether it's testing new features, collecting initial user feedback, or fine-tuning the customer experience, SightX offers a comprehensive suite of features designed to streamline the brand insights process and deliver tangible results.

Let us show you how simple it can be to collect powerful product insights.


Estimated Read Time
4 min read

How to Choose the Right Ad Testing Platform

Ad testing platforms have become indispensable for marketers and advertisers aiming to maximize their ROI. With the right platform, you can uncover critical insights about your audience's preferences, allowing you to craft ads that are both attention-grabbing and highly persuasive. 

Today, we'll explore ad testing- why it's essential, how to use it, and what to look for when choosing the right ad testing platform.


What is Ad Testing?

Ad testing is the process of evaluating the effectiveness of an advertisement before it goes live. This involves testing various ad elements, such as copy, graphics, layout, and overall message, to determine which versions perform best with your target audience. Ad testing helps marketers understand how different components of an ad influence audience perception and behavior, enabling them to make data-driven decisions to optimize their campaigns.


Ad testing can take many forms, including:

bullet point green checkmarkA/B Testing

This involves comparing two versions of an ad to see which one performs better. It is ideal for testing individual elements such as headlines or images.

bullet point green checkmark

Multivariate Testing

This method tests multiple elements simultaneously to understand how they interact. It is more complex but can provide deeper insights.

bullet point green checkmark

Concept Testing

Concept testing allows you to evaluate the overall idea or theme before finalizing an ad to ensure it resonates with your audience.


Why Do Brands Conduct Ad Testing?

Ad testing is a critical component of a successful marketing strategy. Here are some key reasons why brands conduct ad testing:


Screen Ad Ideas Quickly

Ad testing allows brands to screen multiple ad concepts and ideas quickly. By testing different versions of an ad, marketers can identify which ideas resonate most with their audience and which ones fall flat. This process helps narrow down the best concepts, saving time and resources.

In a competitive market, time is of the essence. Rapidly screening ad ideas ensures that only the most promising concepts move forward, accelerating the creative process and enabling marketers to launch effective campaigns faster. This agility can be a significant competitive advantage, allowing brands to stay ahead of trends and respond quickly to market changes.


Test and Perfect Ad Elements

Every element of an ad, from the copy and graphics to the overall formatting, plays a role in its effectiveness. Ad testing enables brands to test and refine these components for optimal performance. By identifying which elements work best, marketers can create more engaging and persuasive ads.

Testing and perfecting ad elements is an iterative process. It allows marketers to improve their ads based on real-time feedback continuously. For instance, if a particular headline outperforms others, it can be integrated into future campaigns. Similarly, understanding the impact of different images or calls to action can lead to more visually appealing and compelling ads.


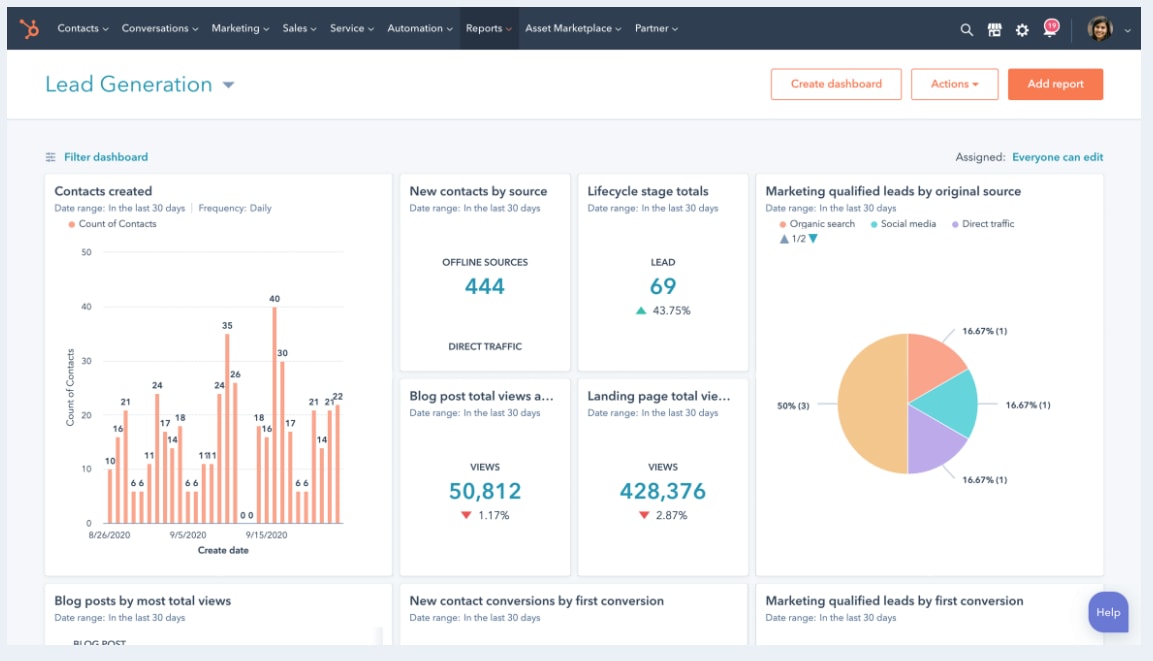
Optimize Campaigns for Your Goals

Whether the goal is to increase brand awareness, drive website traffic, or boost sales, ad testing provides valuable insights that help optimize campaigns for specific objectives. By understanding what works and what doesn't, brands can adjust their strategies to achieve their desired outcomes more effectively.

Ad testing helps in aligning ad strategies with business goals. For example, if the objective is to generate leads, ad testing can identify the elements that drive the highest conversion rates. Similarly, for brand awareness campaigns, testing can reveal which messages and visuals resonate most with the target audience, ensuring the brand is perceived positively and remembered.


Checklist for Choosing the Right Ad Testing Platform

Selecting the right ad testing platform is crucial for obtaining accurate and actionable insights. Here's a checklist to help you make the right choice:


bullet point green checkmark

Robust Experiment Options for Uncovering New Insights

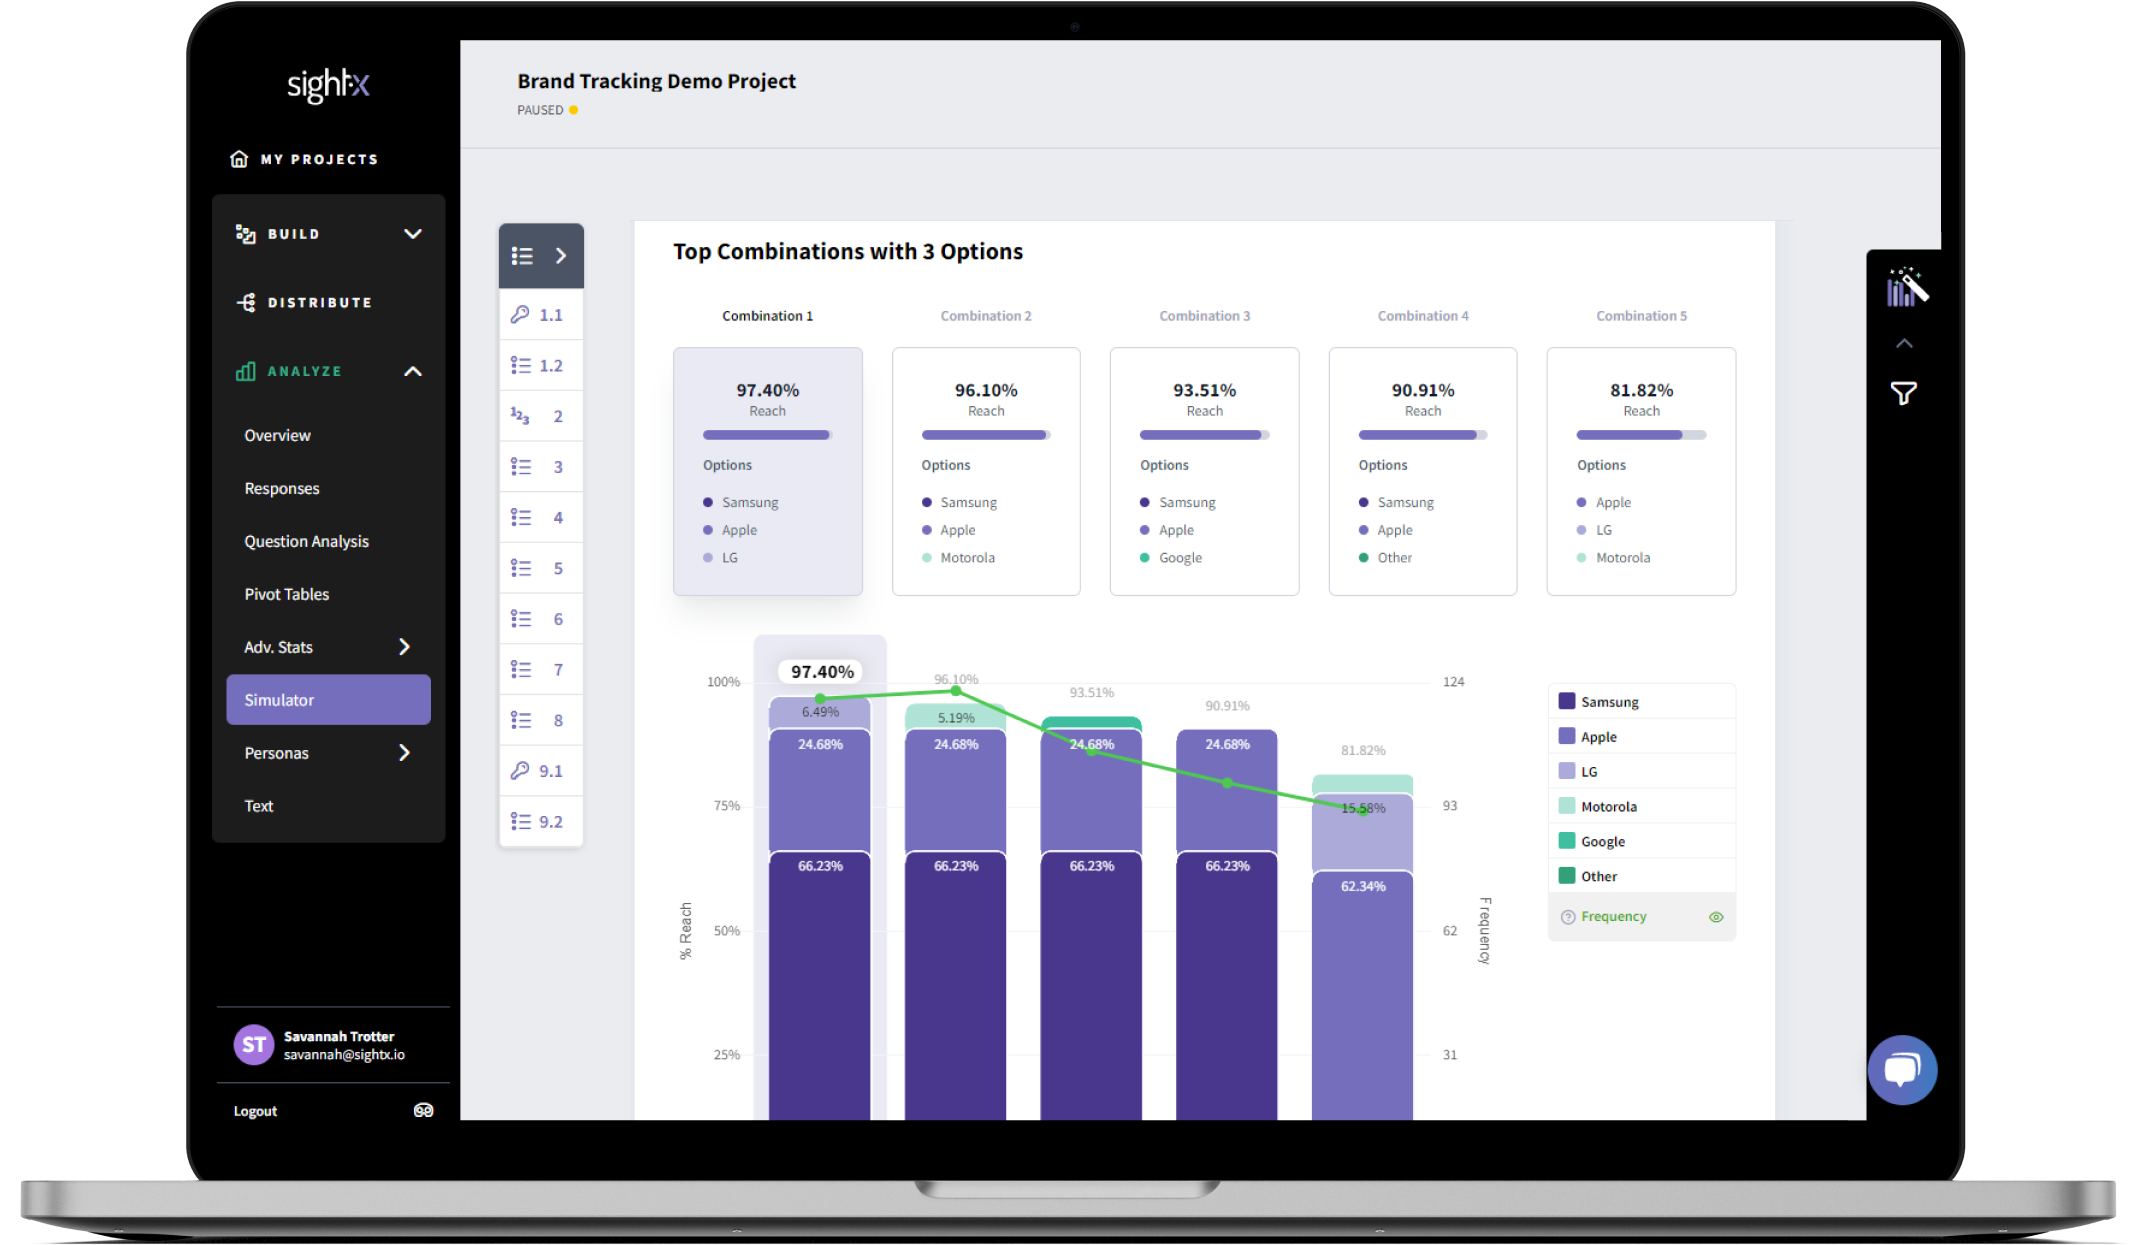
A good ad testing platform should offer various experiment options to explore different hypotheses and uncover new insights. Look for platforms that provide A/B testing, multivariate testing, and other advanced testing methods, such as maxdiff for attribution prioritization, conjoint for optimal packaging, and pricing methodologies for optimizing the pricing of your offering. This flexibility allows you to test various elements and combinations to find the most effective ad components.

Experiment options should also include the ability to test different ad formats, such as video, display, social media, and search ads. This versatility ensures that you can optimize your ads across various channels and touchpoints, leading to a more cohesive and effective marketing strategy.

bullet point green checkmark

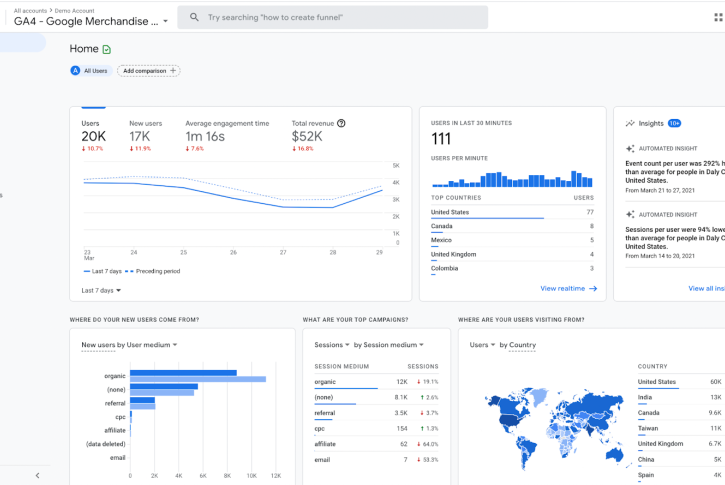
Audience Targeting for Relevant Data

Accurate audience targeting is essential for relevant and reliable ad testing results. The platform should allow you to define and target specific audience segments based on demographics, behavior, interests, and other criteria. This ensures that your tests reflect the preferences and behaviors of your actual target audience.

Advanced targeting options can include geographic, psychographic, and behavioral data, allowing for highly precise targeting. The ability to create custom audience segments based on past interactions with your brand or lookalike audiences can further enhance the relevance and effectiveness of your ad tests.


Frame 300 (1)-1


bullet point green checkmark

AI Analysis, Summary, and Reporting Features for Faster Insights

Time is of the essence in digital marketing. Choose a platform that leverages AI for data summarization, providing quick and accurate insights. AI-powered platforms can help summarize data, identify trends, and generate reports faster than manual methods. This enables you to make timely decisions and optimize your campaigns more efficiently.

AI can also provide predictive insights, suggesting potential outcomes based on historical data. This can help marketers anticipate how changes to ad elements might impact performance, allowing for proactive adjustments and more strategic decision-making.


A GIF from SightX's Ad Testing platform showing ad testing data summarized by AI.


bullet point green checkmark

Support and Ad Testing Services for a DIT (Do It Together) Approach

While some businesses may have in-house expertise, others might benefit from additional support. Look for platforms that offer comprehensive support and ad testing services. A DIT (Do It Together) approach can be particularly helpful, as it combines your team's knowledge with expert guidance from the platform provider, ensuring you get the most out of your ad testing efforts.

Support services can include onboarding assistance, training, and ongoing consultation. Access to a dedicated account manager or customer success team can ensure that you leverage the platform's full capabilities and achieve the best possible results from your ad tests.


How to Conduct Ad Testing with SightX

SightX is a powerful ad testing platform that provides all the tools you need to test and optimize your ads. Here's a step-by-step guide on how to conduct ad testing using SightX:


Set Goals and Objectives

Begin by clearly defining your goals and objectives. What do you hope to achieve with your ad? Whether it's increasing brand awareness, driving traffic, or boosting conversions, having a clear goal will guide your testing process and help you measure success.

Setting specific, measurable, achievable, relevant, and time-bound (SMART) goals ensures that your ad testing efforts are focused and effective. For example, instead of aiming to "increase brand awareness," a SMART goal would be to "increase brand awareness by 20% among the target audience within three months."


Choose Concepts to Test

Decide which elements of your ad you want to test. This could include headlines, images, call-to-action buttons, colors, or layouts. By isolating specific components, you can determine which versions perform best and make informed decisions about what to include in your final ad.

Consider creating a hypothesis for each element you test. For example, if you believe a particular image will drive higher engagement, test it against other images to validate your hypothesis. This structured approach helps you improve your ad elements systematically.


Select an Ad Testing Method

Based on your objectives, choose the appropriate testing method. SightX offers various methods, including A/B testing, multivariate testing, and more. Each method has its strengths, so select the one that best suits your needs.

A/B testing is ideal for comparing two distinct versions of an ad, while multivariate testing helps you understand the impact of multiple elements simultaneously. Concept testing can be used early in the creative process to gauge the overall appeal of different ad ideas.


Set Your Target Audience & Collect Data

Define your target audience using SightX's robust targeting options. Once your audience is set, launch your test and start collecting data. Ensure your sample size is sufficient to provide statistically significant results.

Consider segmenting your audience based on different criteria, such as age, gender, location, or behavior. This allows you to gather more granular insights and tailor your ads to specific segments for maximum effectiveness.


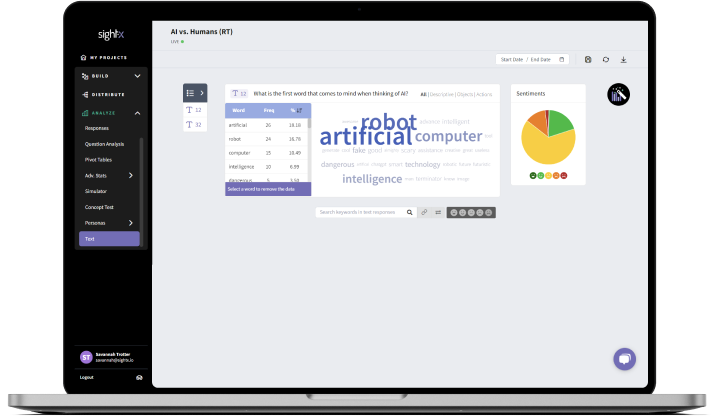
Analyze, Summarize, and Report on Data Instantly with automated analytics and AI-powered summarization

SightX offers automated analytics using the most rigorous statistical analysis. Using AI, the platform will summarize the findings, highlight key insights, and generate comprehensive reports. This allows you to understand which ad variations perform best and why.

AI-powered platforms can also identify patterns and trends that might not be immediately apparent to the researcher. These insights can inform not only your current ad campaigns but also future marketing strategies, ensuring continuous improvement.


Apply Your Findings

Finally, apply the insights gained from your ad testing to optimize your campaigns. Implement the best-performing elements in your final ad and monitor its performance. Continuously test and refine your ads to maintain their effectiveness over time.

Regularly reviewing and updating your ad elements based on testing results ensures that your campaigns stay relevant and effective. This iterative approach helps you adapt to changing market conditions and consumer preferences.


SightX Ad Testing Tools

By infusing the power of generative AI with advanced ad testing tools, SightX makes marketing and advertising research a breeze. 

Green checkmark bullet pointCreate a fully customized survey, study, or experiment with a prompt.
Green checkmark bullet pointCollect data from your target audience.
Green checkmark bullet pointReceive fully analyzed and summarized results in seconds, revealing key insights and personalized recommendations.

Let us show you how simple it can be to collect powerful ad insights. 


Estimated Read Time
7 min read

Tips for Running a Successful Brand Tracking Study

Today, we'll explore the importance of brand tracking studies, how to run them effectively, and how to use the data to refine your brand strategy.


What are Brand Tracking Studies? And Why Would I Run One?

Brand tracking studies are periodic or continuous surveys that measure the health of a brand over time. These studies collect data on various metrics, like brand awareness, perception, loyalty, and overall brand health. The primary goal is to understand how your brand performs in the market and how your customers perceive it compared to competitors.


Why Run a Brand Tracking Study?

green checkmark bullet point. Measure Brand Health

Track key metrics that indicate the overall health of your brand. This includes awareness and deeper insights into how well your brand is resonating with your audience.


green checkmark bullet point.

Understand Customer Perception

Gain insights into how customers perceive your brand and identify areas for improvement. Understanding the emotional and rational connections customers have with your brand is crucial for long-term success.


green checkmark bullet point.

Monitor Market Trends

Stay informed about market trends and how they impact your brand. This allows you to anticipate changes in the market and adapt your strategies accordingly.


green checkmark bullet point.

Improve Marketing Strategy

Use data to refine and enhance your marketing and branding strategies. With a clear understanding of brand performance, you can optimize your marketing efforts to drive better results.


green checkmark bullet point.

Stay Competitive

Keep an eye on competitor performance and adjust your strategies to maintain a competitive edge. Knowing where your brand stands compared to competitors helps you identify opportunities and threats in the market.


How to Run a Brand Tracking Study

Running an effective brand tracking study involves several steps to ensure you gather accurate and actionable data.


Set Goals for your Brand Tracker

Define clear and measurable goals for your brand tracking study. What specific aspects of your brand do you want to monitor? Common goals include measuring brand awareness, understanding customer loyalty, and tracking brand perception. Having well-defined goals helps guide the development of your study and ensures you collect relevant data.


Select Your Audience

Identify your target audience for the study. This should include current customers, potential customers, and even those who are aware of your brand but have not yet made a purchase. Ensure your sample is representative of your broader market. It's also important to segment your audience based on demographics, behaviors, and other relevant factors to gain more nuanced insights.


Develop Your Brand Tracking Strategy

Create a detailed plan for your brand tracking study. This includes:

green checkmark bullet point.

Writing Questions: Develop a set of questions that will help you measure the key metrics related to your brand's health. Ensure your questions are clear, unbiased, and relevant to your goals.


green checkmark bullet point.

Setting Cadence: Decide how often you will conduct the survey. Monthly, quarterly, and bi-annual surveys are common frequencies. The cadence you choose should balance the need for up-to-date data with the potential for respondent fatigue.


green checkmark bullet point.

Choosing Survey Method: Select the appropriate survey method (e.g., online surveys, telephone interviews) based on your audience and goals. Online surveys are often more cost-effective and can reach a larger audience, but telephone interviews may provide deeper insights.


Start Monitoring

Once your strategy is in place, start collecting data. Use consistent methods and questions to ensure the data is comparable over time. It's important to have a robust data collection system in place to manage the responses effectively and ensure data quality.


Track Metrics Over Time for Brand Insights

Monitor the data over time to identify trends and changes in key metrics. Look for patterns that indicate shifts in brand perception, awareness, and loyalty. Consistent tracking lets you understand how your brand's performance evolves and what factors influence these changes.


Tips for Running Your Own Brand Tracker

green checkmark bullet point.

Be Consistent: Use the same questions and methods across all survey waves to ensure data consistency and reliability. Consistency is key to accurately tracking changes over time.

green checkmark bullet point.

Segment Your Data: Break down your data by different segments (e.g., demographics, customer vs. non-customer) to gain deeper insights. Segmentation helps you understand how different groups perceive your brand and tailor your strategies accordingly.

green checkmark bullet point.

Benchmark Against Competitors: Compare your brand's performance with your competitors to identify areas of strength and opportunities for improvement. Competitive benchmarking provides context for your brand's performance.

green checkmark bullet point.

Act on Insights: Use the insights gained from your study to make informed decisions and adjustments to your branding and marketing strategies. Implement changes based on data-driven insights to improve brand health.

green checkmark bullet point.

Keep it Simple: Avoid overcomplicating the survey. Focus on the most critical metrics to keep respondents engaged and ensure high-quality data. A concise survey is more likely to be completed and provide reliable insights.

green checkmark bullet point.

Engage Your Team: Involve your marketing, sales, and product teams. Their input can help refine your survey and ensure it aligns with broader business objectives.

green checkmark bullet point.

Regularly Review and Update: Periodically review your brand tracking strategy and update it as needed to reflect changes in your market or business goals. Keeping your study relevant ensures it continues to provide valuable insights.

green checkmark bullet point.

Use Technology: Leverage advanced survey tools and analytics platforms to streamline data collection and analysis. Technology can enhance the efficiency and accuracy of your brand tracking efforts.

green checkmark bullet point.

Consider Qualitative Insights: Supplement your quantitative data with qualitative insights through focus groups or in-depth interviews. These insights can provide context and depth to your survey findings.

green checkmark bullet point.

Communicate Results: Share the findings with relevant stakeholders in your organization. Clear communication ensures that insights are understood and acted upon effectively.


How to Use Brand Tracking Data

The data collected from a brand tracking study can be incredibly valuable if used effectively.


Assess Your Brand Health

Regularly monitor key metrics to assess the overall health of your brand. Look for any significant changes that might indicate issues or opportunities for growth. Brand awareness, perception, and loyalty are critical brand health indicators.


Improve Key Brand Metrics Like Loyalty or Awareness

Identify areas where your brand is underperforming and develop strategies to improve these metrics. For example, consider increasing your marketing efforts or revising your messaging if brand awareness is low. Understanding the drivers of loyalty can help you develop programs that enhance customer retention and satisfaction.


Adjust and Perfect Your Branding

Use the insights from your brand tracking study to refine your branding. This could involve adjusting your brand's positioning, improving customer service, or developing new marketing campaigns that better resonate with your audience. Continuous improvement based on data-driven insights helps keep your brand relevant and competitive.


The Drawbacks of Brand Tracking

While brand tracking studies offer numerous benefits, there are also some drawbacks to consider:

green checkmark bullet point.

Cost: Continuous brand tracking can be expensive, especially for smaller businesses. It's important to balance the need for regular data with budget constraints.

green checkmark bullet point.

Time-Consuming: Setting up and maintaining a brand tracking study requires significant time and resources. Ensure you have the necessary resources and commitment to sustain the study over time.

green checkmark bullet point.

Data Overload: Managing and analyzing large amounts of data can be challenging and may require specialized skills and tools. Investing in the right tools and expertise is crucial for effective data management.

green checkmark bullet point.

Survey Fatigue: Frequent surveys can lead to respondent fatigue, which can impact the quality and reliability of the data collected. To mitigate this, consider varying the survey frequency and ensuring that surveys are engaging and relevant.

Despite these challenges, the benefits of brand tracking often outweigh the drawbacks, providing valuable insights that can drive strategic decisions and enhance brand performance.


Brand Tracking with SightX

Brand tracking studies are a powerful tool for understanding and improving your brand's health. By setting clear goals, selecting the right audience, and using the data effectively, you can ensure your brand remains competitive and resonates with your target audience. Embrace these tips to run a successful brand tracking study and take your brand to new heights.

By infusing the power of generative AI with advanced brand tracking survey tools, SightX makes brand research a breeze. 

Green checkmark bullet pointCreate a fully customized survey, study, or experiment with a prompt.
Green checkmark bullet pointCollect data from your target audience.
Green checkmark bullet pointReceive fully analyzed and summarized results in seconds, revealing key insights and personalized recommendations.

Let us show you how simple it can be to collect powerful brand insights. 


Estimated Read Time
6 min read

Conjoint Simulator: What it is and How to use it

If you work in market research or insights, it's a safe bet that you are very familiar with conjoint analysis.

For those who don't know, a conjoint experiment is used to better understand the value people place on specific aspects of a product. It helps companies build.

Today, we'll explore conjoint simulators, looking at what they are, how they are used, and what insights you can get from them.

But, before we dive into the details- let's define a few terms we'll be using:

green checkmark bullet point. Attributes: These are more commonly known as the features of your product or service. They are the aspects of your offering that respondents will evaluate. For example, the attributes of a cell phone could be price, color, size, camera quality, durability, battery life, or brand.

Type=Default, Size=sm, Color=SuccessLevels: These are simply the options for each attribute you will test. Continuing the example above, you may want to understand the value people place on the number of hours the battery lasts, the camera quality, or the color of the cell phone itself.

Type=Default, Size=sm, Color=SuccessCombinations: This is the hypothetical product (or service) offering generated during the experiment. It's the total package of your attributes with randomized levels displayed.


What is a Conjoint Simulator?

A Conjoint experiment is a technique designed to uncover the value people assign to different aspects of a product. It proves especially useful when you're developing new products or services and are still determining which features matter most (and least) to consumers.

The insights from a Conjoint experiment ensure your offerings align well with consumer expectations and preferences.

SightX offers a comprehensive simulator based on conjoint results that enables you to:

Type=Default, Size=sm, Color=SuccessDivide your respondents into segments with similar preferences.
Type=Default, Size=sm, Color=SuccessDetermine the market share distribution of products of interest.
Type=Default, Size=sm, Color=SuccessAnalyze how changes in pricing affect the demand for products in a competitive environment.


How to Conduct a Conjoint Experiment

The initial step of conducting your conjoint experiment is to break down your product or service into distinctive features that may influence consumer preferences, called 'Attributes.' You can specify the respective variations for each attribute, referred to as' levels.'

This is better illustrated with an example: Imagine we're in the business of crafting sophisticated men's dress shoes, and we're on a mission to create new styles that genuinely resonate with our target market. To achieve this, we've decided to use a conjoint experiment to understand what features our customers want in a shoe.

From experience, we know a shoe can be described by its Style, Material, Color, and Price. These will be our attributes.  Based on what we can create at our factory, we define the possible levels of each attribute as follows:

Styles: Oxford, Monk Strap, and Derby

Materials: Leather, Faux Leather, and Canvas

Colors: Black, Brown, and Chesnutt

Pricing: $160, $170, and $180


The conjoint experiment will generate bundles based on the above combination of attributes and levels. 


Constraining your products

In some cases, there may be limitations on the combinations you can present to consumers. Using SightX's conjoint tools, you have the flexibility to:

Type=Default, Size=sm, Color=SuccessDefine level combinations that must not appear together, like premium finishings and a low price point.
Type=Default, Size=sm, Color=SuccessDefine combinations that must be shown.

These constraints should be used sparingly as they will affect the results of your experiment.


The "None" option 

You can give your respondents a "none" option to give them more flexibility. This can improve the results of your experiment by not forcing users to choose options they would not choose in a real-life scenario. 


Conjoint Outputs & Simulators

Conjoint results will show how the respondents valued each level on average. The higher their value, the more they are preferred. Additionally, you will see how vital the attributes themselves are to respondents. The higher their percentage, the more critical an attribute is to users when making a decision.

To get a deeper understanding of consumer preferences, we also offer a simulator where you can:

Type=Default, Size=sm, Color=SuccessDivide your respondents into groups with similar preferences.
Type=Default, Size=sm, Color=SuccessDetermine the market share distribution of products of interest.
Type=Default, Size=sm, Color=SuccessAnalyze how alterations in pricing affect the demand for products in a competitive environment.


Segmentation Tool

When running a conjoint experiment, you usually have respondents from different segments within your sample.

For example, let's say we are launching a new zero-sugar drink. During research and development, we could study on carbonated drinks to better understand what the market is looking for. In that study, we would likely have multiple segments of consumers. One segment may prefer drinks with no sugar, another segment may not like the taste of artificial sweeteners, and the rest may be indifferent to sugar content.

Our target market would likely be those who prefer no-sugar drinks and (potentially) those who are indifferent to sugar content. Using a segmentation look (like SightX's automated segmentation tool), you can divide your respondent population into distinct groups based on shared characteristics. Specify your own parameters, or let AI find the optimal number of groups.

A screenshot from SightX's conjoint segmentation tool.


For each segment, you will see:

Type=Default, Size=sm, Color=SuccessThe number of people who belong to it. 
Type=Default, Size=sm, Color=SuccessThe importance of each level for that segment.
Type=Default, Size=sm, Color=SuccessThe importance of each attribute for that segment.


Market Share Simulator

The average level and attribute importance can give us insights into how consumers value the different aspects of our product or service.

Our market share tool uses individual preferences to determine what products people would choose when a bundle is presented.  It is like having a group of people who you could task to choose between as many products as needed.

A screenshot from SightX's market simulator tool.

Let's say we are a company that produces soft drinks, and we want to introduce a new no-sugar beverage to the market; as such, we want to get an idea of how this product will perform against our competitors' other four no-sugar drinks. Our simulator tells you that 10% of potential buyers preferred our product, and the other 90% is distributed among the other beverages. From this, you might want to take a step back and analyze why your product would not be as competitive as you would like it to be.

Next, you could change some product characteristics and make it compete again with the other soft drinks until you find a product that performs well or satisfies your expectations.


Demand Curve Simulator

This simulator is used to study how the demand for a product, competing with other products, is affected by changes in price. To calculate demand curves, we first need to define the products of interest to us. A product's demand curve is calculated by keeping the price of the other products constant; the price is set to the price defined in the product definition.

In our simulation, you can choose whether you want the demand curves of one product or all the products. If you have more than one price attribute, you can select what attribute should be used. Once you have defined your products, click on the "Find demand curves" button. You will get a curve(s) indicating how the demand for the product(s) of interest changes as the price of the product increases:


A screenshot of SightX's demand simulator tool.


Demand curves let us estimate your products' price elasticity of demand (PED) over a certain price range. The PED tells you how sensitive the demand for your product is regarding price changes over the specified range.

If PED is less than one, we say that our product is inelastic, i.e., changing the price of our product will have a negligible effect on the demand. On the other hand, if the PED is equal to or greater than one, we say that our product is elastic; that is, changes in price will have a significant impact on the demand for the product. 


Conducting Conjoint Experiments with SightX

By infusing the power of generative AI with advanced market research studies and survey tools, SightX makes collecting insights a breeze. 

Green checkmark bullet point. Create a customized survey, study, or experiment with a prompt, a template, or from scratch. 
Green checkmark bullet point. Collect data from your chosen audience. 
Green checkmark bullet point. Receive fully analyzed results in seconds, revealing key insights and personalized recommendations.

Let us show you how simple it can be to use conjoint analysis to optimize your products and pricing. 


Estimated Read Time
6 min read

How to Use Concept Testing for Your Creative Assets

The success of your creative assets can significantly impact your brand's performance. From ads to packaging, logos to user interfaces, testing your creative concepts before launching them to the public is essential.

Today, we'll explore the concept of creative testing, its importance, and how to implement it effectively.


What is Creative Testing?

Creative testing is a specialized form of concept testing focused on evaluating the effectiveness of creative assets. These assets can include advertisements, packaging designs, logos, or user interfaces (UI). The goal is to gather feedback from your target audience to refine and optimize these elements before a full-scale launch.


When to Use Creative Concept Testing

Testing your creative assets is beneficial in various scenarios, providing crucial insights to refine and optimize your creative assets. Here are a few situations where creative testing proves invaluable:


Ad Testing

Before launching a new advertising campaign, testing different versions of your ads can determine which resonates best with your audience. This helps in maximizing click-through and conversion rates.


Why It's Important

Advertising is a significant investment, and its success directly impacts your brand's visibility and sales. An ad that resonates well with your target audience can lead to higher engagement, better brand recall, and improved marketing ROI. Conversely, an ad that misses the mark can waste valuable resources and even harm your brand's reputation.


How to Execute Ad Testing

Green checkmark bullet pointA/B Testing: Present different versions of your ad to similar audience segments and compare performance metrics such as click-through rates (CTR), conversion rates, and engagement levels.
Green checkmark bullet pointSplit Testing: Similar to A/B testing, but with multiple variations to identify the best-performing elements of each ad.
Green checkmark bullet pointFocus Groups: Gather small groups of your target audience to discuss their reactions to different ad concepts. This qualitative feedback can provide deeper insights into emotional and cognitive responses.


Ad Testing Example

A company launching a new skincare product might test ads emphasizing different benefits – one highlighting anti-aging properties, another focusing on natural ingredients, and a third showcasing customer testimonials. The company can refine its messaging to align with audience preferences by analyzing which ad performs best.


Package Testing

Packaging is often the first point of contact between your product and the consumer. Testing different packaging designs ensures that your product stands out on the shelf and communicates the right message.


Why It's Important

Effective packaging not only attracts attention but also conveys the product's benefits and brand values. Packaging influences purchasing decisions and can differentiate your product from competitors. Poor packaging can result in a lack of interest and missed sales opportunities.


How to Run Package Testing

Green checkmark bullet pointShelf Testing: Simulate a retail environment and observe how consumers interact with your packaging among competitors.
Green checkmark bullet pointVisual Preference Surveys: Show participants different packaging designs and ask which they prefer and why.
Green checkmark bullet pointUsability Testing: Assess practical aspects such as ease of opening, readability of information, and durability.


Package Testing Example

A beverage company might test various bottle shapes, label designs, and color schemes to see which combination grabs the most attention and conveys the desired brand message. Insights from packaging tests can lead to a design that not only looks appealing but also communicates freshness and quality, leading to higher sales.


Logo Testing

Your logo is a key element of your brand identity. Testing different logo designs can help you choose the one that best represents your brand and appeals to your target market.


Why It's Important

A logo is often the first visual representation of your brand that consumers encounter. It must effectively convey your brand's essence and values while being memorable and recognizable. A well-designed logo can enhance brand loyalty and recognition, while a poorly designed one can confuse or alienate your audience.


How to Execute Logo Testing

Green checkmark bullet pointPreference Testing: Present different logo designs to your audience and gather feedback on which they find most appealing and why.
Green checkmark bullet pointAssociation Testing: Assess what values, emotions, or characteristics participants associate with each logo.
Green checkmark bullet pointRecall Testing: Test how easily participants can recall each logo after a short period, which indicates memorability.


Logo Testing Example

A startup might test several logo options reflecting different aspects of its brand identity – innovation, trustworthiness, or fun. By evaluating audience responses, the startup can select a logo that not only stands out but also effectively communicates its core values and resonates with its target market.


UI Testing

User interface design is critical for digital products. Testing different UI designs ensures that your application or website is user-friendly and provides a seamless user experience.


Why It's Important

A well-designed user interface enhances usability and satisfaction, leading to higher user retention and engagement. Conversely, a poorly designed UI can frustrate users, leading to abandonment and negative reviews. In digital products, the user interface is often the first point of interaction, making its design crucial for overall success.


How to Conduct UI Testing

Green checkmark bullet pointUsability Testing: Have users perform specific tasks on your UI and observe where they encounter difficulties. Gather qualitative feedback on their experience.
Green checkmark bullet pointA/B Testing: Compare different UI layouts or elements to see which performs better in terms of user metrics like task completion rates, time on task, and error rates.
Green checkmark bullet pointHeuristic Evaluation: Have usability experts review your UI against established usability principles and identify potential issues.


UI Testing Example

An e-commerce site might test different checkout process designs to determine which layout minimizes cart abandonment and maximizes conversion rates. By iterating on user feedback and performance data, the company can optimize its UI to create a smoother, more intuitive shopping experience that encourages purchases.


Why Should You Test Your Creative?

Creative testing offers several advantages:


Improve Ad Click-Through and Conversion Rates

Testing your ad creatives helps you identify which versions generate the highest engagement and conversions. This leads to more effective advertising campaigns and a better return on investment.


Perfect Packaging Design and Claims

By testing packaging designs and claims, you can ensure that your product not only attracts attention but also clearly communicates its benefits and value proposition.


Optimize Your UI

Testing UI designs allows you to create a more intuitive and user-friendly interface. This can lead to higher user satisfaction and retention rates.


Elevate Your Branding

Testing logos and other brand elements helps you create a strong and consistent brand identity. This can enhance brand recognition and loyalty.


Tools for Creative Testing

There are various tools available to facilitate creative testing. Here are five tools, including SightX, that can help you gather and analyze feedback effectively:

Green checkmark bullet pointSightX: An all-in-one research platform that offers advanced analytics and visualization tools to help you make data-driven decisions.
Green checkmark bullet pointUserTesting: A platform that provides real-time feedback on your UI designs by connecting you with a diverse pool of testers.
Green checkmark bullet pointUsabilityHub: A tool specifically designed to test UI designs, logos, and other visual elements and provide quick feedback from real users.


How to Use Creative Testing


Gather Your Creative Concepts or Briefs

Start by collecting the creative assets you want to test. This could include ad copies, packaging designs, logo options, or UI mockups.


Identify the Target Audience

Determine who your target audience is for the creative asset. Understanding your audience's preferences and behaviors is crucial for obtaining relevant feedback.


Choose a Creative Concept Testing Methodology

Select a testing methodology that suits your needs. The two primary methodologies are:

Green checkmark bullet pointMonadic Testing

In monadic testing, each participant is exposed to a single creative concept. This method minimizes bias and allows for focused feedback on each concept.

Green checkmark bullet pointSequential Monadic Testing

In sequential monadic testing, participants are exposed to multiple creative concepts in a random order. This method enables comparison between different concepts but may introduce some bias due to the order of presentation.


Analyze the Testing Data to Find Key Insights

Once you have collected feedback, analyze the data to identify patterns and key insights. Look for common themes in the responses and pay attention to both quantitative and qualitative data.


Apply the Results and Iterate

Use the insights gained from your analysis to refine and improve your creative assets. Don't be afraid to iterate multiple times to achieve the best possible outcome.


Creative Testing with SightX

By infusing the power of generative AI with advanced concept testing survey tools, SightX makes collecting insights a breeze.

green checkmark bullet point. Create fully customized concept tests with a prompt.

green checkmark bullet point. Collect data from your target audience.

green checkmark bullet point. Receive fully analyzed and summarized results in seconds, revealing key insights and personalized recommendations.

Let us show you how simple it can be to collect powerful insights with concept testing.


Estimated Read Time
6 min read