
If you work in market research or insights, it's a safe bet that you are very familiar with conjoint analysis.
For those who don't know, a conjoint experiment is used to better understand the value people place on specific aspects of a product. It helps companies build.
Today, we'll explore conjoint simulators, looking at what they are, how they are used, and what insights you can get from them.
But, before we dive into the details- let's define a few terms we'll be using:
![]() Attributes: These are more commonly known as the features of your product or service. They are the aspects of your offering that respondents will evaluate. For example, the attributes of a cell phone could be price, color, size, camera quality, durability, battery life, or brand.
Attributes: These are more commonly known as the features of your product or service. They are the aspects of your offering that respondents will evaluate. For example, the attributes of a cell phone could be price, color, size, camera quality, durability, battery life, or brand.
![]() Levels: These are simply the options for each attribute you will test. Continuing the example above, you may want to understand the value people place on the number of hours the battery lasts, the camera quality, or the color of the cell phone itself.
Levels: These are simply the options for each attribute you will test. Continuing the example above, you may want to understand the value people place on the number of hours the battery lasts, the camera quality, or the color of the cell phone itself.
![]() Combinations: This is the hypothetical product (or service) offering generated during the experiment. It's the total package of your attributes with randomized levels displayed.
Combinations: This is the hypothetical product (or service) offering generated during the experiment. It's the total package of your attributes with randomized levels displayed.
What is a Conjoint Simulator?
A Conjoint experiment is a technique designed to uncover the value people assign to different aspects of a product. It proves especially useful when you're developing new products or services and are still determining which features matter most (and least) to consumers.
The insights from a Conjoint experiment ensure your offerings align well with consumer expectations and preferences.
SightX offers a comprehensive simulator based on conjoint results that enables you to:
![]() Divide your respondents into segments with similar preferences.
Divide your respondents into segments with similar preferences.![]() Determine the market share distribution of products of interest.
Determine the market share distribution of products of interest.![]() Analyze how changes in pricing affect the demand for products in a competitive environment.
Analyze how changes in pricing affect the demand for products in a competitive environment.
How to Conduct a Conjoint Experiment
The initial step of conducting your conjoint experiment is to break down your product or service into distinctive features that may influence consumer preferences, called 'Attributes.' You can specify the respective variations for each attribute, referred to as' levels.'
This is better illustrated with an example: Imagine we're in the business of crafting sophisticated men's dress shoes, and we're on a mission to create new styles that genuinely resonate with our target market. To achieve this, we've decided to use a conjoint experiment to understand what features our customers want in a shoe.
From experience, we know a shoe can be described by its Style, Material, Color, and Price. These will be our attributes. Based on what we can create at our factory, we define the possible levels of each attribute as follows:
Styles: Oxford, Monk Strap, and Derby
Materials: Leather, Faux Leather, and Canvas
Colors: Black, Brown, and Chesnutt
Pricing: $160, $170, and $180
The conjoint experiment will generate bundles based on the above combination of attributes and levels.
Constraining your products
In some cases, there may be limitations on the combinations you can present to consumers. Using SightX's conjoint tools, you have the flexibility to:
![]() Define level combinations that must not appear together, like premium finishings and a low price point.
Define level combinations that must not appear together, like premium finishings and a low price point.![]() Define combinations that must be shown.
Define combinations that must be shown.
These constraints should be used sparingly as they will affect the results of your experiment.
The "None" option
You can give your respondents a "none" option to give them more flexibility. This can improve the results of your experiment by not forcing users to choose options they would not choose in a real-life scenario.
Conjoint Outputs & Simulators
Conjoint results will show how the respondents valued each level on average. The higher their value, the more they are preferred. Additionally, you will see how vital the attributes themselves are to respondents. The higher their percentage, the more critical an attribute is to users when making a decision.
To get a deeper understanding of consumer preferences, we also offer a simulator where you can:
![]() Divide your respondents into groups with similar preferences.
Divide your respondents into groups with similar preferences.![]() Determine the market share distribution of products of interest.
Determine the market share distribution of products of interest.![]() Analyze how alterations in pricing affect the demand for products in a competitive environment.
Analyze how alterations in pricing affect the demand for products in a competitive environment.
Segmentation Tool
When running a conjoint experiment, you usually have respondents from different segments within your sample.
For example, let's say we are launching a new zero-sugar drink. During research and development, we could study on carbonated drinks to better understand what the market is looking for. In that study, we would likely have multiple segments of consumers. One segment may prefer drinks with no sugar, another segment may not like the taste of artificial sweeteners, and the rest may be indifferent to sugar content.
Our target market would likely be those who prefer no-sugar drinks and (potentially) those who are indifferent to sugar content. Using a segmentation look (like SightX's automated segmentation tool), you can divide your respondent population into distinct groups based on shared characteristics. Specify your own parameters, or let AI find the optimal number of groups.
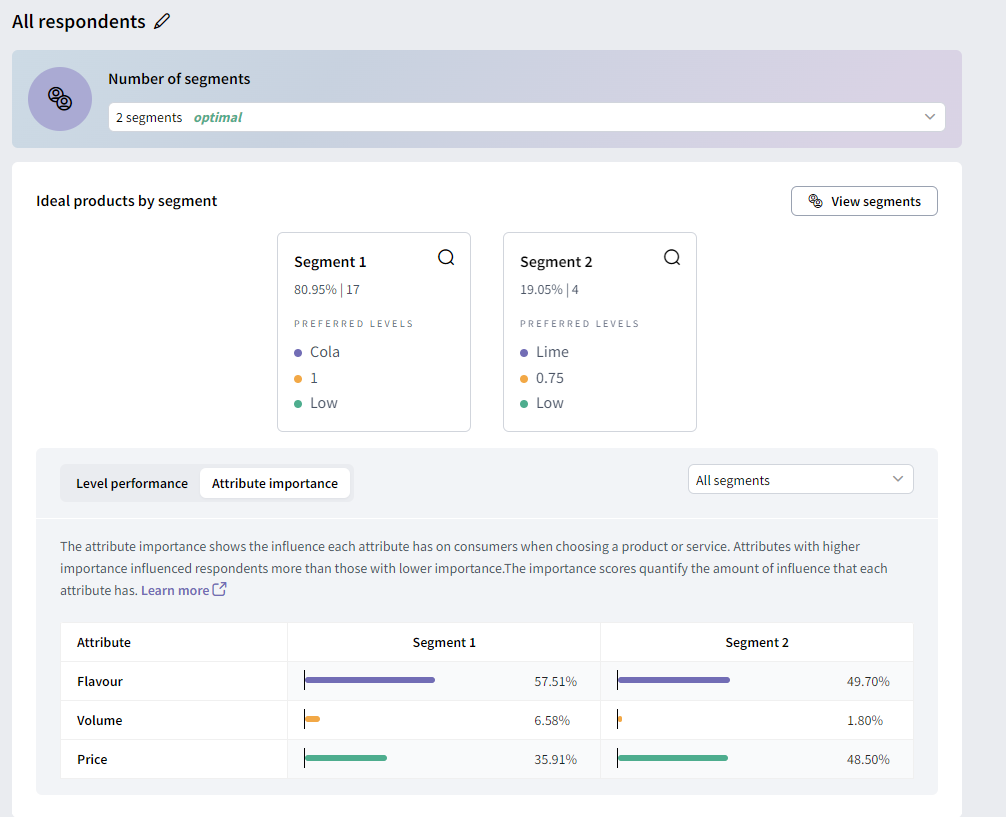
For each segment, you will see:
![]() The number of people who belong to it.
The number of people who belong to it. ![]() The importance of each level for that segment.
The importance of each level for that segment. ![]() The importance of each attribute for that segment.
The importance of each attribute for that segment.
Market Share Simulator
The average level and attribute importance can give us insights into how consumers value the different aspects of our product or service.
Our market share tool uses individual preferences to determine what products people would choose when a bundle is presented. It is like having a group of people who you could task to choose between as many products as needed.
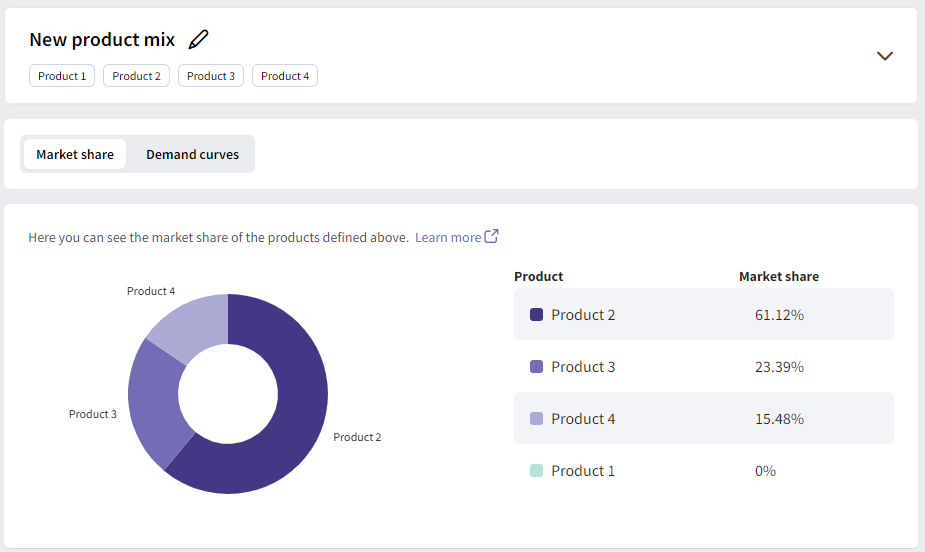
Let's say we are a company that produces soft drinks, and we want to introduce a new no-sugar beverage to the market; as such, we want to get an idea of how this product will perform against our competitors' other four no-sugar drinks. Our simulator tells you that 10% of potential buyers preferred our product, and the other 90% is distributed among the other beverages. From this, you might want to take a step back and analyze why your product would not be as competitive as you would like it to be.
Next, you could change some product characteristics and make it compete again with the other soft drinks until you find a product that performs well or satisfies your expectations.
Demand Curve Simulator
This simulator is used to study how the demand for a product, competing with other products, is affected by changes in price. To calculate demand curves, we first need to define the products of interest to us. A product's demand curve is calculated by keeping the price of the other products constant; the price is set to the price defined in the product definition.
In our simulation, you can choose whether you want the demand curves of one product or all the products. If you have more than one price attribute, you can select what attribute should be used. Once you have defined your products, click on the "Find demand curves" button. You will get a curve(s) indicating how the demand for the product(s) of interest changes as the price of the product increases:
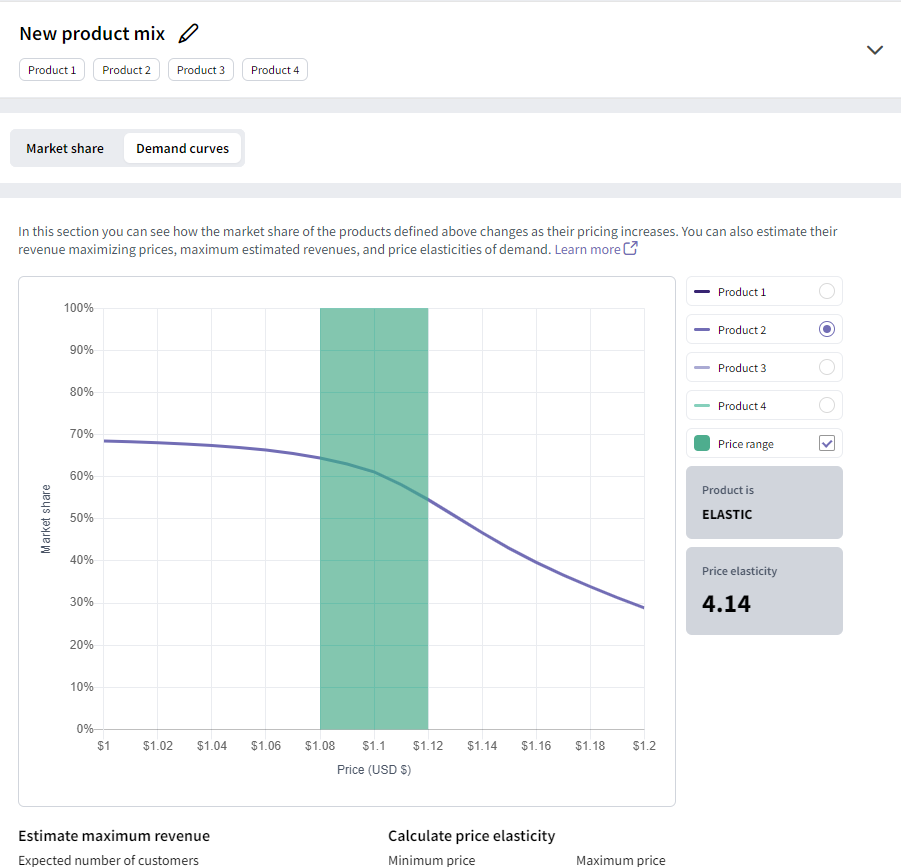
Demand curves let us estimate your products' price elasticity of demand (PED) over a certain price range. The PED tells you how sensitive the demand for your product is regarding price changes over the specified range.
If PED is less than one, we say that our product is inelastic, i.e., changing the price of our product will have a negligible effect on the demand. On the other hand, if the PED is equal to or greater than one, we say that our product is elastic; that is, changes in price will have a significant impact on the demand for the product.
Conducting Conjoint Experiments with SightX
By infusing the power of generative AI with advanced market research studies and survey tools, SightX makes collecting insights a breeze.
![]() Create a customized survey, study, or experiment with a prompt, a template, or from scratch.
Create a customized survey, study, or experiment with a prompt, a template, or from scratch. ![]() Collect data from your chosen audience.
Collect data from your chosen audience. ![]() Receive fully analyzed results in seconds, revealing key insights and personalized recommendations.
Receive fully analyzed results in seconds, revealing key insights and personalized recommendations.
Let us show you how simple it can be to use conjoint analysis to optimize your products and pricing.
Share this post