What influences customers to buy your products? How can you drive higher rates of customer loyalty? And what will attract new customers?
Answering these questions is crucial to the long-term success of any organization. But when it comes to metrics like customer satisfaction, brand loyalty, or purchase intent you've got to understand not only which factors play a role but also their degree of impact.
This is why many companies use Key Driver Analysis (KDA) to better understand how different elements influence customer behavior and brand performance. Here's how it works:
What are Drivers?
Before we get too deep into the "analysis" portion of a key driver analysis, let's examine the drivers themselves.
Drivers are the factors that can potentially impact your organization's performance. And the factors that have the most meaningful impact on performance are known as key drivers.
Your specific drivers (and key drivers) will be entirely dependent on your category and use case. For example, if you're trying to better understand your customer satisfaction score (CSAT), then the drivers you might want to investigate would be pricing, customer service, quality, or customer experience. However, if you’re evaluating your new website, you may want to look at drivers like overall design, user experience, or speed.
While all of the drivers you investigate will likely matter in some shape or form to your customers, their level of significance may vary. This leads us to the analysis portion...
What is Key Driver Analysis?
Key driver analysis (KDA) is a technique used in market research to identify the key drivers that influence a specific outcome or behavior. It does this by evaluating a group of drivers- like quality, product design, customer experience, or price- and weighs their relative importance in predicting an outcome.
For example, let's say you just received data from a customer satisfaction (CSAT) survey, but the numbers weren't quite what you'd hoped for. While you recognize that you'll need to change something to improve your CSAT score, you're not quite sure which factors influenced this downturn in the first place.
This is where key driver analysis comes into play.
Using this technique you can survey respondents to evaluate all of the potential factors involved to understand which are the most important to your customers and how they would rate your performance on each.
From the data, you can quickly see which areas are most impactful for your target market, where you're already succeeding, and what you can do to improve.
But key driver analysis doesn’t just help with customer satisfaction, it can also help you answer questions like:![]() What can we do to grow brand loyalty?
What can we do to grow brand loyalty? ![]() How can we increase purchase intent for a specific market segment?
How can we increase purchase intent for a specific market segment? ![]() Should we focus on reducing prices or enhancing the quality of our products to improve sales?
Should we focus on reducing prices or enhancing the quality of our products to improve sales?
What Are the Benefits of Using Key Driver Analysis?
With so many brands competing for attention, your success is based on how much you really know about your ideal customer.
Unfortunately, asking people directly what motivates them to purchase your products, or why their loyalty is fading isn't very effective. In fact, most consumer behavior is subconscious, making it difficult for most to accurately explain their purchase behavior.
Key driver analysis enables organizations to understand the "whys" behind the metrics that matter most and how different factors contribute to their ultimate success (or failure). With these insights, you can better understand which levers you can pull to positively impact the metrics most important to you.
How to Use Key Driver Analysis
With SightX, assessing your key drivers has never been simpler.
After selecting “Key Driver Analysis” from the add-item menu, the experiment will immediately populate, giving you the space to add a description of your product.
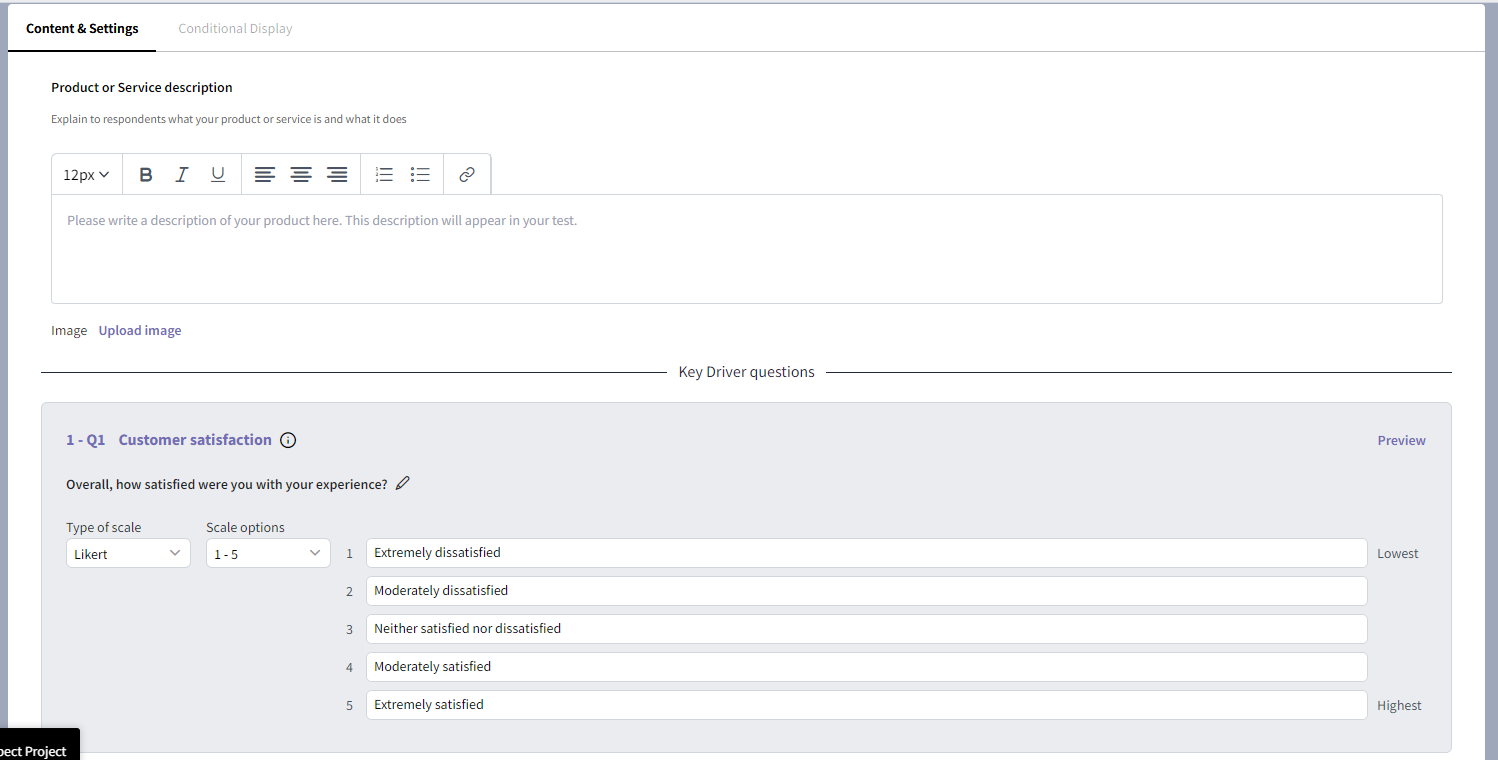
Beneath that you will see pre-populated questions.
The first question is a CSAT question where you can choose between a standard likert scale or slider for rating. The next question you will see is an optional churn question asking respondents how likely they are to use a different product next time they make a purchase.
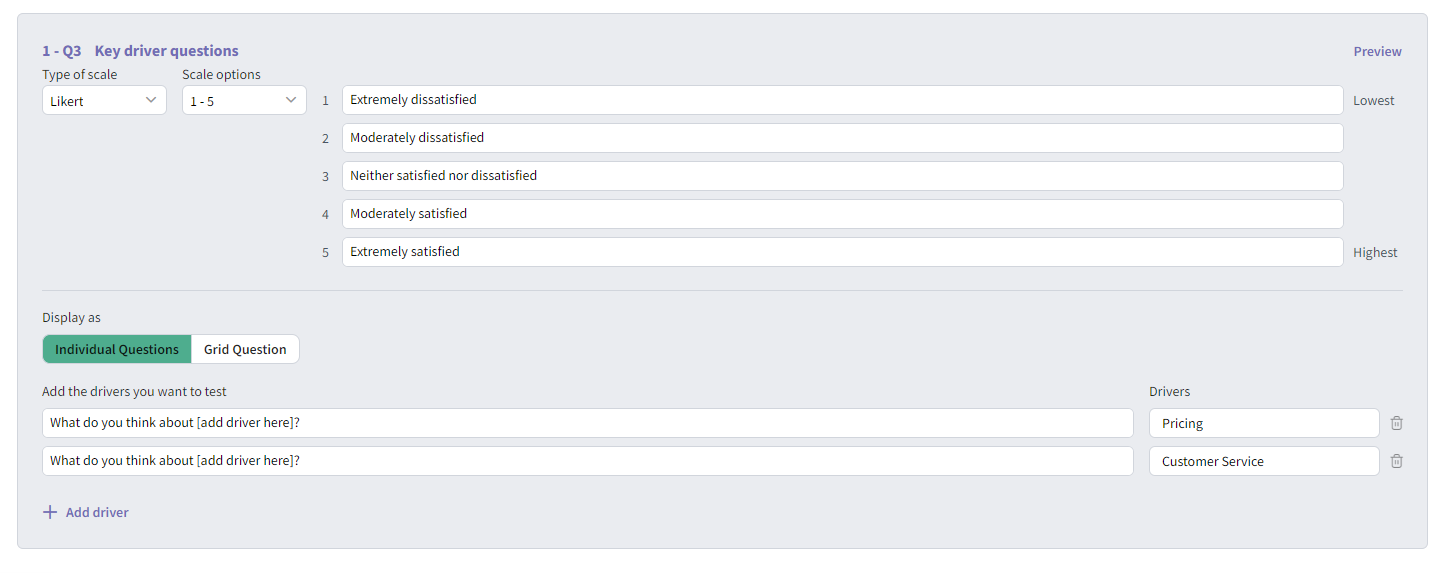
After that, you’ll see your key driver questions. Here you can input the drivers you want to investigate- like price, customer service, product design, or experience- and choose the phrasing of your question. You can also choose to display these questions individually or as a matrix.
After your study is complete, you’ll have a graph similar to this:
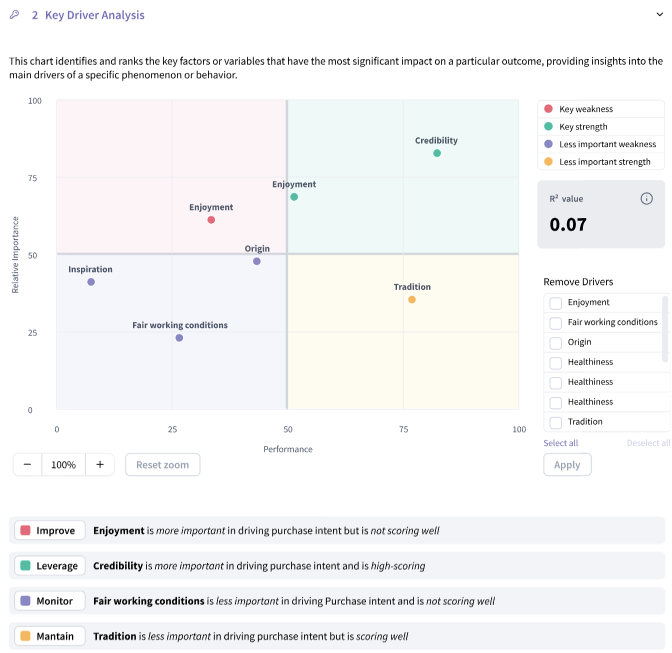
You’ll immediately notice the chart is broken into 4 clear quadrants: ![]() Drivers in the Green Quadrant have high performance scores and a high level of importance to customers. You will definitely want to take note of the drivers in this quadrant as you can leverage your success in these areas to keep customers satisfied with a relatively low lift.
Drivers in the Green Quadrant have high performance scores and a high level of importance to customers. You will definitely want to take note of the drivers in this quadrant as you can leverage your success in these areas to keep customers satisfied with a relatively low lift. ![]() Drivers in the Red Quadrant have low performance scores but carry a high level of importance for customers. This quadrant highlights which elements of your business you should improve to drive the greatest impact.
Drivers in the Red Quadrant have low performance scores but carry a high level of importance for customers. This quadrant highlights which elements of your business you should improve to drive the greatest impact. ![]() Drivers in the Purple Quadrant have low performance scores and low importance scores. While you shouldn’t ignore them entirely, you can likely leave these on the back burner without much of an impact on your business.
Drivers in the Purple Quadrant have low performance scores and low importance scores. While you shouldn’t ignore them entirely, you can likely leave these on the back burner without much of an impact on your business. ![]() Drivers in the Yellow Quadrant have high performance scores but are of low importance to consumers. While it is good to understand all of the areas you are succeeding in, these drivers don’t necessarily need your focus.
Drivers in the Yellow Quadrant have high performance scores but are of low importance to consumers. While it is good to understand all of the areas you are succeeding in, these drivers don’t necessarily need your focus.
Looking at the sample data above, you can see that our company scored high in credibility- which is also highly important to consumers. This means that we can (and should) leverage our credibility in our messaging.
On the other hand, we scored quite low in enjoyment- which is also important to consumers. With this data, we can create a follow-up survey to better understand what we can change about our product or experience to make it a bit more enjoyable for customers.
Key Driver Analysis with SightX
If you’re ready to discover the key drivers behind your most important KPI’s, we’ve got the tools to make it simple.
The SightX platform is the next generation of market research tools: a single unified solution for consumer engagement, understanding, advanced analysis, and reporting.
But, SightX isn’t just great tech. Our Research Services team knows all of the best practices, along with some pro tips and tricks for getting the best data out of your surveys and experiments.
Reach out to our team to get started today!
Share this post