Surveys are foundational for gathering data on consumer preferences, attitudes, and behaviors. But, the true value of surveys lies not merely in data collection but in an effective analysis that transforms raw responses into actionable insights.
To unlock the full potential of your research efforts, thoroughly analyzing your survey data is a must. So today, we will walk through ten of the best strategies to maximize the value of your survey data.
1. Define Clear Survey Goals & Objectives
Before you even begin drafting your survey, you will need to establish clear objectives that outline the insights you aim to derive from the data.
To start, define the research questions you seek to answer and the specific metrics or variables you intend to measure. Consider how the data will be used, what decisions it may inform, and what teams within your organization will be impacted by the results. This will give you a solid place to start.
By clarifying the objectives of your survey upfront, you can better focus your analysis efforts and ensure that the data you collect will actually be helpful to your business goals.
2. Cleanse and Validate Your Survey Data
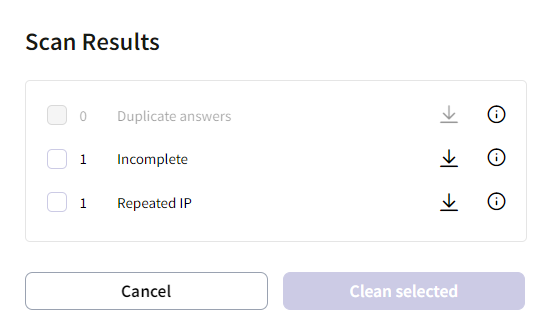
One final step before proceeding with analysis is to clean your survey data to ensure its accuracy, completeness, and consistency.
There are a couple of ways to accomplish this. You can look at the individual responses to your survey questions and identify any missing or erroneous responses.
If you'd rather not dig through your survey responses manually, you can use an automated data-cleaning system (like the one available in SightX). Just like manual checks, automated survey data cleaning tools verify the integrity of your data by conducting checks for duplicate responses, inconsistencies, and data entry errors.
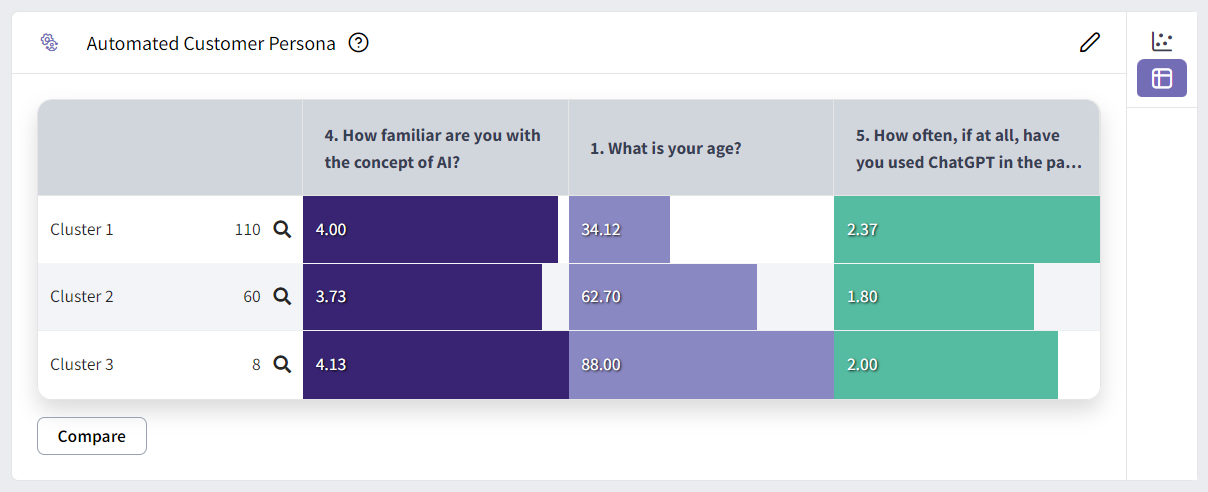
3. Segment and Stratify Survey Responses
Once you have made it to the actual survey analysis, you should begin by segmenting and stratifying your respondents into meaningful groups based on demographic characteristics, psychographic profiles, behaviors, or other variables relevant to your research.
Depending on your research goals, your criteria for segmentation may include age, location, income level, purchase intent, gender, or some other preference.
Once your survey respondents are segmented, analyze the data within each segment to uncover patterns, preferences, trends, or unique behaviors. You will find that these factors are likely to change based on the segment you are examining.
4. Conduct a Descriptive Analysis of Your Survey Data
A descriptive analysis involves summarizing and describing your survey data using statistical measures, visualizations, and narrative techniques. This will lay the foundation for deeper exploratory and inferential analyses.
You can start by calculating the summary stats for your survey question data, like mean, median, mode, standard deviation, and frequency distributions. Many automated market research platforms, like SightX, will handle this part for you by providing these stats for each question and visualizing them in charts, graphs, and tables.
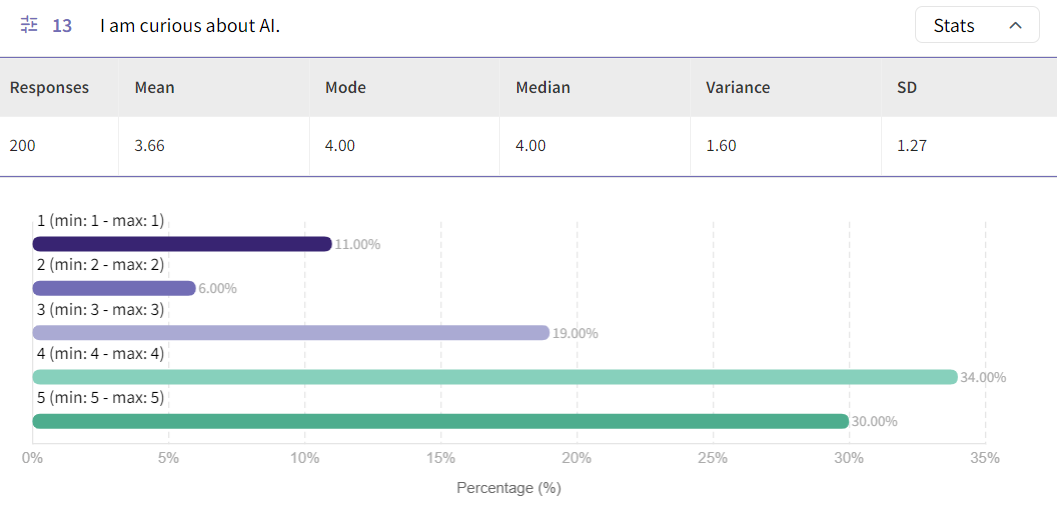
A descriptive analysis will give you an overview of the data distribution and central tendencies, helping you quickly spot patterns, trends, and relationships.
5. Explore Relationships and Correlations Within Your Survey Data
Exploratory analysis uncovers relationships, associations, and correlations between different variables in your survey.
You can conduct bivariate (comparison of two variables) or multivariate (comparisons of multiple variables) analysis to see how variables interact with each other.
For example, you could explore the relationship between age and purchase intent. Or, you could investigate how location and income level affect shopping behaviors.
Using automated tools for cross-tabulation (also known as pivot tables), correlation analysis, regression analysis, and factor analysis will allow you to quickly uncover patterns and dependencies within your survey data.
Ultimately, you can gain insights into key drivers and factors influencing survey outcomes by understanding the underlying relationships between variables.
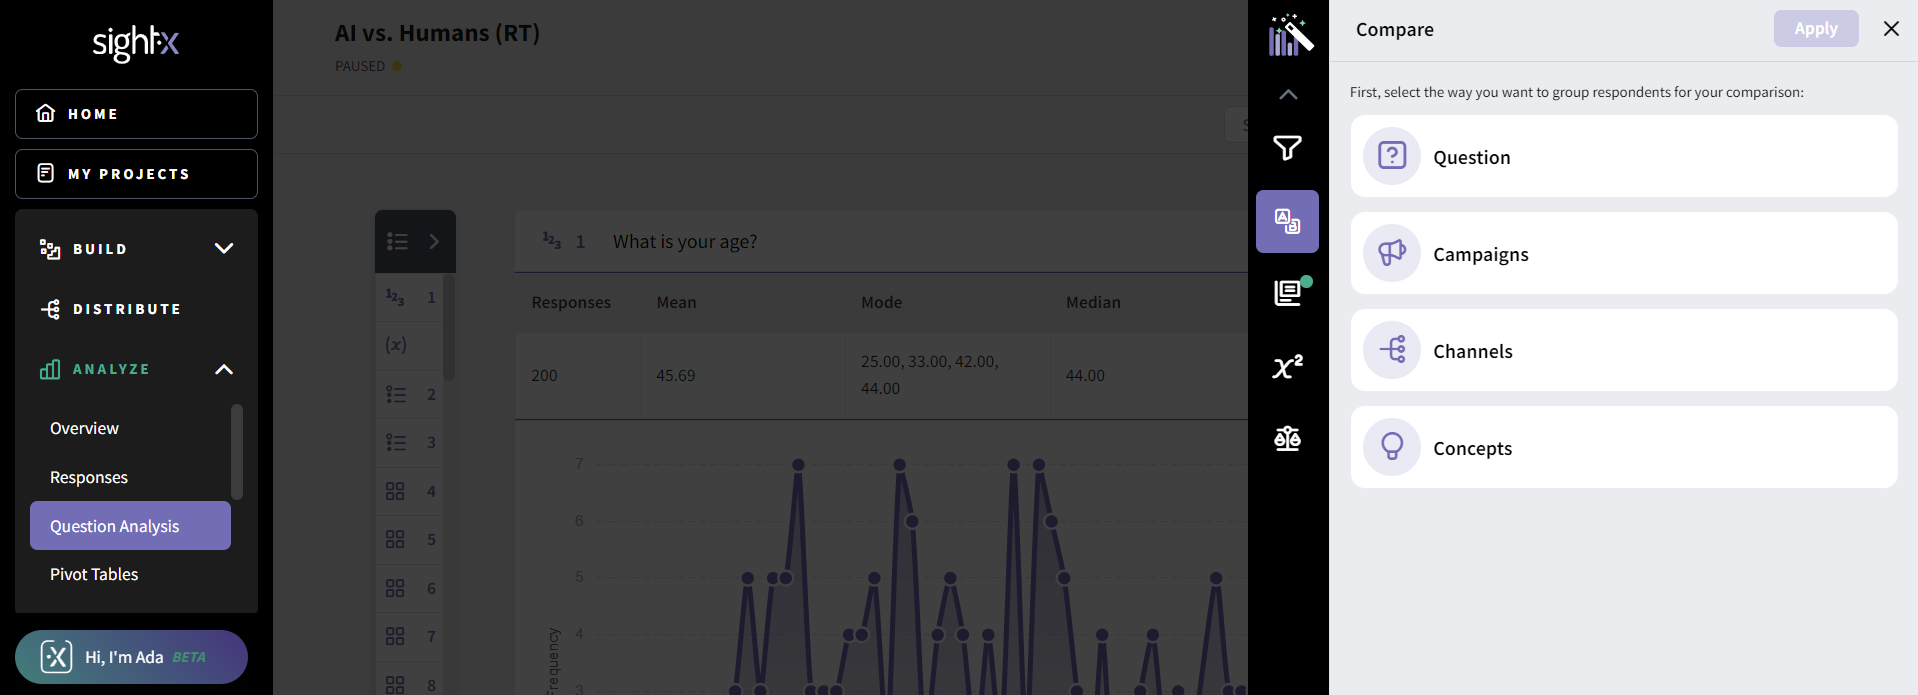
6. Compare Audience Segments, Conditions, or Time Periods for Your Survey Data
A comparative analysis involves comparing survey responses across different conditions. This could include comparing responses between various demographic groups, customer base segments, or even survey waves to assess changes over time and better differentiate the groups within your audience base.
You can utilize statistical tests like t-tests, ANOVA, chi-square, or regression analysis. If you'd rather not do stats by hand, you can use automated survey analysis tools (like SightX) to determine differences and their significance and draw meaningful conclusions from the comparisons.
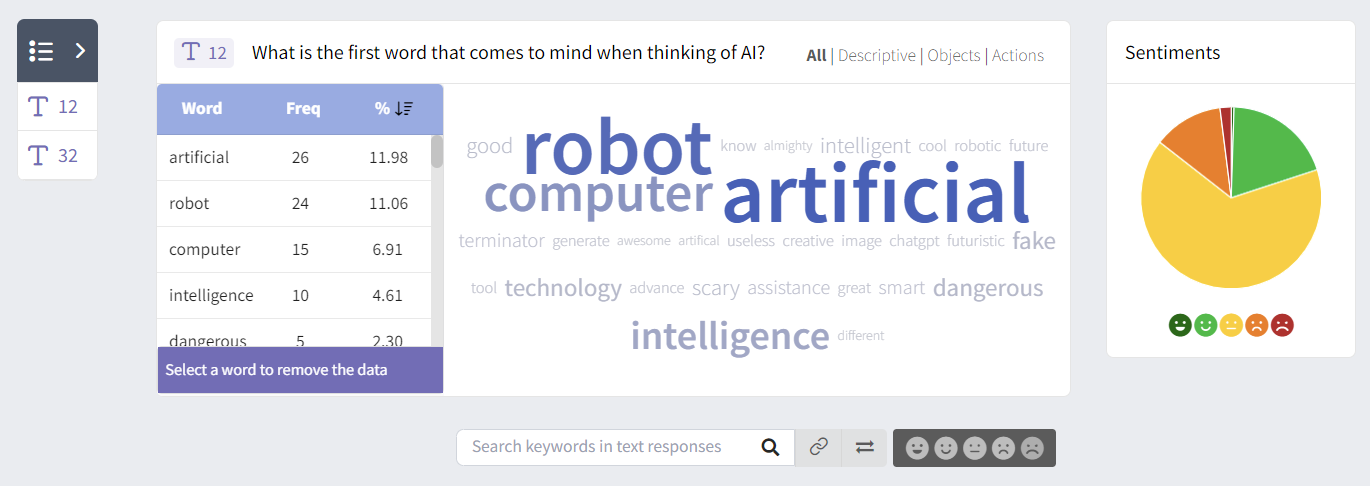
7. Conduct Text Analysis on Your Open-Ended Survey Responses
Outside of quantitative analysis methods, you can use text analysis to extract qualitative insights from your open-ended survey questions.
You can use Natural Language Processing (NLP) and sentiment analysis tools to categorize, summarize, and analyze textual survey data.
Using these AI text analysis tools, you can identify recurring themes, sentiments, keywords, and topics within responses. This will provide rich contextual information and give you a deeper understanding of the "why" behind customer perceptions, opinions, and preferences.
8. Validate Your Survey Findings
Validation is a critical step in the survey analysis process to ensure your findings' reliability, validity, and credibility.
You can validate your findings by checking for consistency, coherence, and statistical significance within the results. You can also compare your survey results with external benchmarks, industry norms, or historical data to assess consistency and alignment with expectations.
To validate qualitative insights, you can check that they match your quantitative findings or conduct member checks with respondents.
9. Interpret and Synthesize Insights
Once all of the analysis is completed, it's time to make sense of your findings. Interpretation involves synthesizing your results, drawing conclusions, and deriving actionable insights.
Think back to your original questions, objectives, and goals for your survey. What answers does the data provide, what does that mean for your company, and who needs this information?
This can be a great time to employ generative AI (like SightX's Ada)!
Generative AI tools are excellent at analyzing and condensing large data sets into digestible information. So, it stands to reason that this skill would be ideal for survey data!
For example, when using SightX's AI research consultant Ada, you can ask her to distill your findings into an executive summary. This will instantly analyze all of your survey data and produce key findings from the results in seconds.

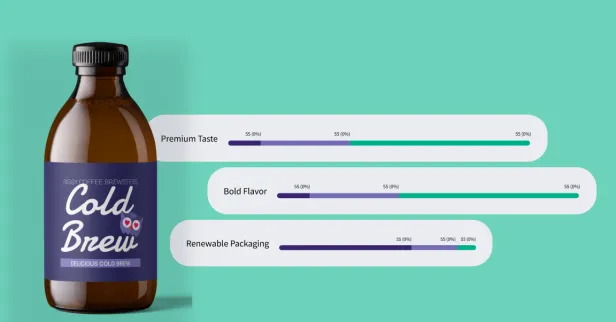
10. Communicate Your Survey Findings Effectively
The final step in survey analysis is to communicate your findings in a clear, concise, and compelling manner.
Save any visualizations from the analysis platform you have worked in. You can use them in your reports, presentations, custom dashboards, or infographics summarizing key insights, findings, and recommendations.
In your insights reports or presentations, provide actionable recommendations and next steps based on survey findings to inform decision-making.
Survey Analysis with SightX
Historically, research and insights work was costly, time consuming, fragmented, and not widely shared....so we decided to change that.
SightX is an AI-driven market research platform offering a single unified solution for product, brand, marketing, and pricing research. While powerful enough for insights teams at Fortune 500 companies, our user-friendly interface makes it simple for anyone to start, optimize, and scale their research.
And with our new Generative AI consultant, Ada, you can harness the power of OpenAI's GPT to transform your marketing research and insights. Collaborating with Ada is like having an expert researcher, brilliant statistician, and ace marketer on your team, helping you ask the right questions, choose the best experiments, pick out key insights, and seamlessly apply them to your business.
Share this post